1. Introduction
SQL Server is a powerful tool for managing databases and the data housed therein. However, like any tool, it’s necessary to monitor and keep track of its performance to ensure maximum efficiency. This is where MS SQL Monitors come into play.
1.1 Importance of MS SQL Monitor
An MS SQL Monitor is of paramount importance in maintaining and enhancing the performance of a SQL Server. It helps database administrators to monitor database performance, bottleneck issues, resolve problems faster, and keep an eye on significant metrics. These metrics include long-running queries, SQL jobs, failed jobs, among others, thus ensuring smoother operations. Therefore, a reliable SQL Monitor is an invaluable tool in any data-oriented organization.
1.2 SQL Recovery Tool
A monitor is not enough for most of DBA. Sometimes, when data disaster occurs, we need a good SQL recovery tool to recover data from corrupt databases. DataNumen SQL Recovery is the best one in the market:
1.3 Objectives of this Comparison
The objective of this comparison is to provide an understanding of various SQL Monitoring tools available in the market. We will explore their strengths and weaknesses, allowing you to make the best decision tailored to your specific needs. This comparison will cover a range of monitors, including but not limited to Applications Manager’s SQL Monitoring, Devart SQL Server Performance Monitoring Tool, and the Database Engine Tuning Advisor.
By the end of this comparison, you should be well equipped to select a tool that will help you optimize your SQL Server performance, resilient to growing data demands, and aligns with your organizational strategies.
2. Applications Manager’s SQL Monitoring
Applications Manager offers a Microsoft SQL Server Monitoring tool that provides useful IT solutions. It’s designed to oversee the performance of SQL databases, while simultaneously identifying bugs and resolving issues that could lead to halts in an organization’s operation.
Under the ManageEngine suite, Applications Manager’s SQL Monitoring tool provides comprehensive monitoring capabilities across a multitude of performance metrics. It allows administrators to troubleshoot performance issues, plan capacity, and ensure optimal SQL Server performance. From tracking slow queries to monitoring replication, this tool provides end-to-end SQL database monitoring.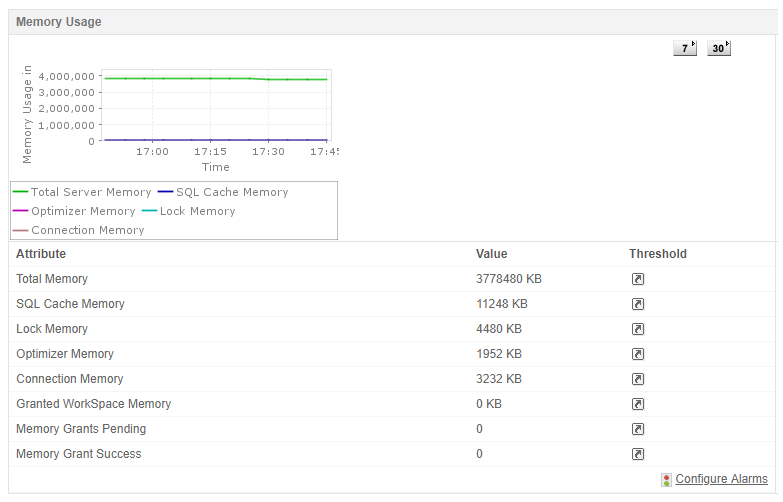
2.1 Pros
- Real-time monitoring: This tool gives real-time insights into the performance of your SQL Server, which helps to troubleshoot issues instantly.
- Anomaly detection: It immediately recognizes any anomaly in the servers and sends alerts instantly.
- SQL Server Reporting: Includes detailed reports about database health, availability, performance and uses these data analytics to optimize future performance.
- Multi-level thresholds: Allows you to set multiple thresholds for each attribute and sends alerts if the thresholds are violated.
2.2 Cons
- Interface: Some users have reported that the interface is not as user-friendly as some other SQL monitoring tools.
- Price: Depending on the size of your organization or the complexity of your needs, Applications Manager’s pricing could be high.
- Customization: While it does offer a lot of features, certain users might find customization options somewhat limited compared to other platforms.
3. Devart SQL Server Performance Monitoring Tool
Devart is a recognized provider of database connectivity solutions and developer tools. Among their offerings, is the SQL Server Performance Monitoring Tool, a tool geared towards improving the efficiency of SQL servers.
The Devart SQL Server Performance Monitoring tool, also known as dbForge Monitor, is a comprehensive feature for database management and SQL server performance monitoring. It offers an array of services, from performance metrics to server logs, making it a versatile tool for database administrators aiming for optimal server performance.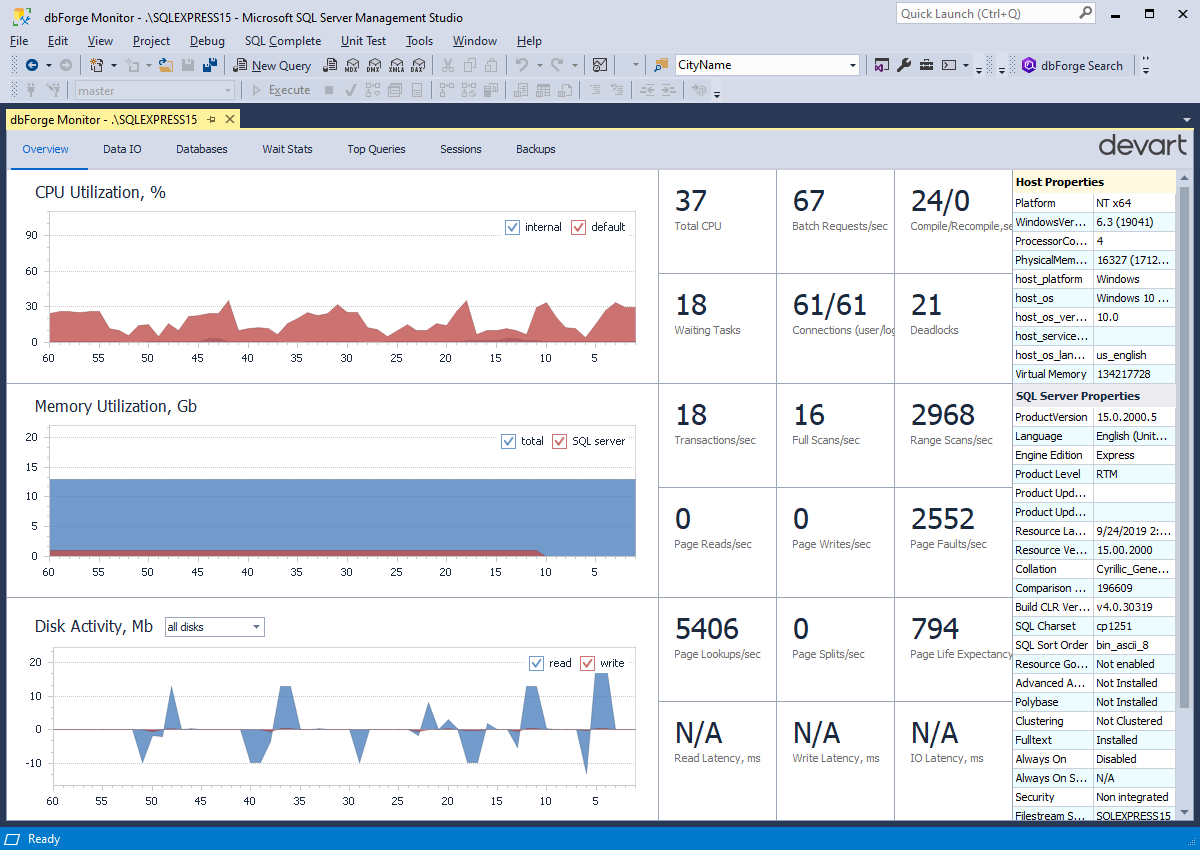
3.1 Pros
- Comprehensive monitoring: The tool offers server metrics, wait statistics, and other valuable data, making it a comprehensive solution for monitoring.
- Alerts: DbForge Monitor sends out notifications based on predefined conditions, assuring a pro-active measure against potential issues.
- Data storage: It stores and records the performance metrics at regular intervals, making it easier to analyze trends and prevent future performance problems.
- Integrated SQL development: Bundled in dbForge Studio for SQL Server, it combines SQL monitoring with other development tools, putting everything into one place.
3.2 Cons
- Complexity: The vast array of features can overwhelm beginners to SQL monitoring, and thus it has a steeper learning curve.
- Limited database types: It caters specifically to Microsoft SQL servers, and may not be suitable for those looking to monitor other database types.
- Paid product: Unlike some other SQL monitoring tools, dbForge Monitor is not available for free and may not fit into the budget for smaller organisations or individuals.
4. Database Engine Tuning Advisor
The Database Engine Tuning Advisor is a tool that is underpinned by Microsoft, designed to assist in the optimization of database performance through tuning.
The Database Engine Tuning Advisor (DTA) is essentially a performance tuning utility that is a part of Microsoft SQL Server. It provides recommendations on how to evolve database structures to improve server performance. DTA is capable of assessing multiple databases in a single session, with recommendations on partitioning that can be executed across the databases. It also offloads the heavy-lifting of performance tuning to an automated engine, freeing up DBAs to focus on more strategic tasks.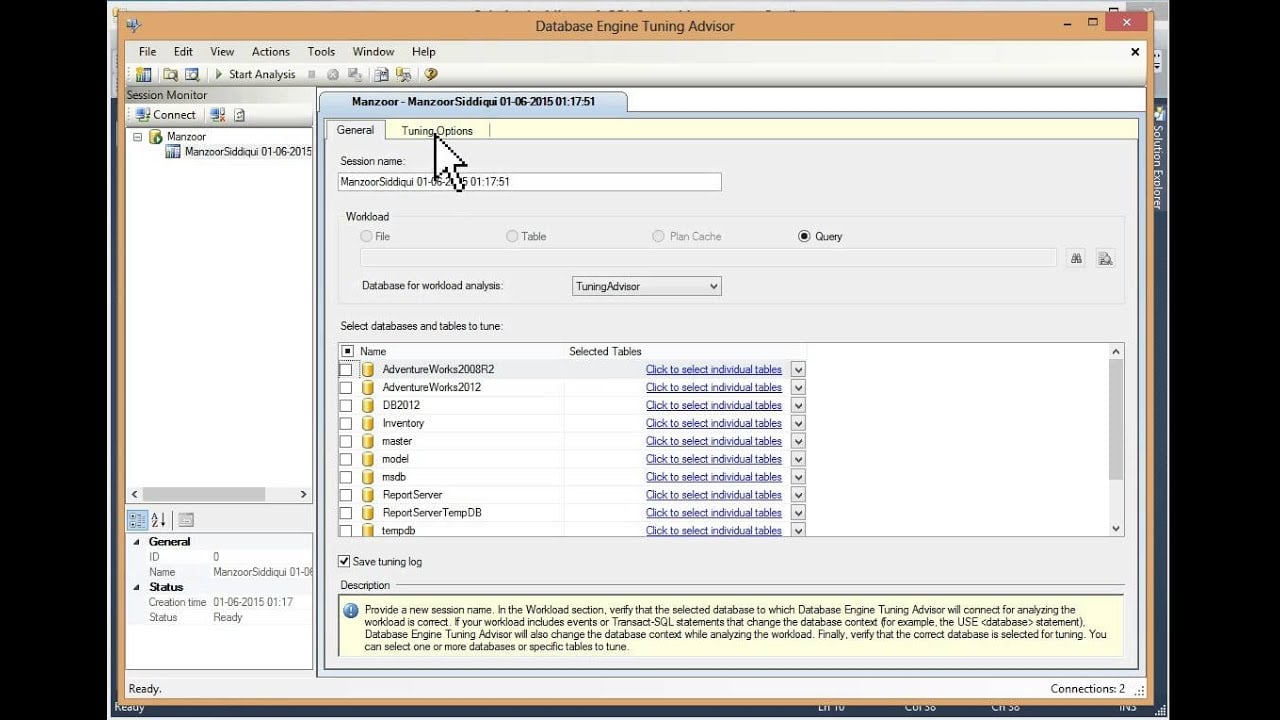
4.1 Pros
- Analytical capabilities: DTA provides in-depth analysis of query performance and offers vital tuning recommendations.
- Ease of use: Being an in-built feature of MS SQL Server, using it and accessing it is relatively straightforward.
- Automatic tuning: It’s capable of automating the tuning of databases to boost performance, making it an effortless procedure.
- Workload analysis: DTA supports workload analysis from several sources, making it highly adaptable in a range of scenarios.
4.2 Cons
- Execution plans: DTA does not actually implement the recommendations — this still needs to be done manually.
- Resource intensive: It may consume a lot of server resources while running and analyzing data, which can have an impact on existing tasks.
- Narrow scope: DTA focuses mainly on indexes and physical database structures, and does not consider code optimization or SQL tuning.
5. Database Experimentation Assistant (DEA)
The Database Experimentation Assistant is a solution offered by Microsoft that assists with database upgrade recommendations based on workload analytics.
The Database Experimentation Assistant (DEA) is a tool provided by Microsoft designed to guide businesses through the arduous process of upgrading databases, as it provides compatibility checks and performance differences between SQL Server versions. It performs A/B testing for workload trace files and executes thorough analysis, thereby generating detailed reports.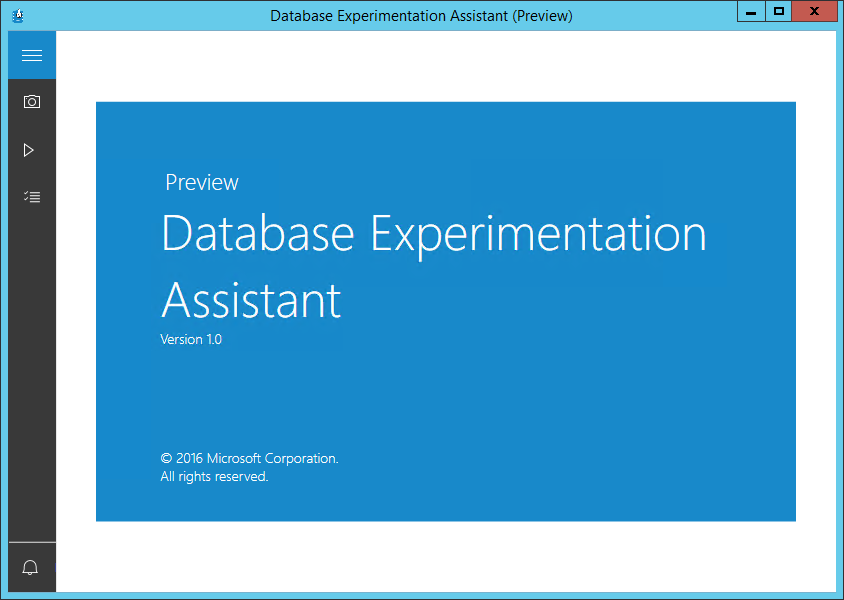
5.1 Pros
- Upgrade assistance: It provides invaluable help when upgrading to new database versions.
- Performance insights: DEA does not limit its function to compatibility checks; it also provides performance comparison reports between SQL versions.
- Workload capturing: It can capture trace files to conduct A/B testing, giving more precise and detailed insights.
- Data-driven: It enables data-driven decision making which is beneficial for strategic planning.
5.2 Cons
- Learning curve: This tool has a steeper learning curve as it is geared towards more advanced SQL users.
- Resource-intensive: Depending on the size of the trace files, DEA can be quite demanding on hardware resources.
- No real-time monitoring: Unlike other tools, DEA does not provide real-time monitoring and alerts; it is mainly focussed on database upgrade scenarios.
6. Extended Events
Extended Events is a lightweight performance monitoring system that allows you to collect data to diagnose performance issues in SQL Server.
Extended Events, also known as XEvents, is a feature of SQL Server that is used to monitor and troubleshoot issues. Unlike SQL Server Profiler and Trace, it has very little impact on system performance. This tool allows for detailed analysis and is quite flexible, making it a beneficial tool for diagnosing complex SQL Server problems.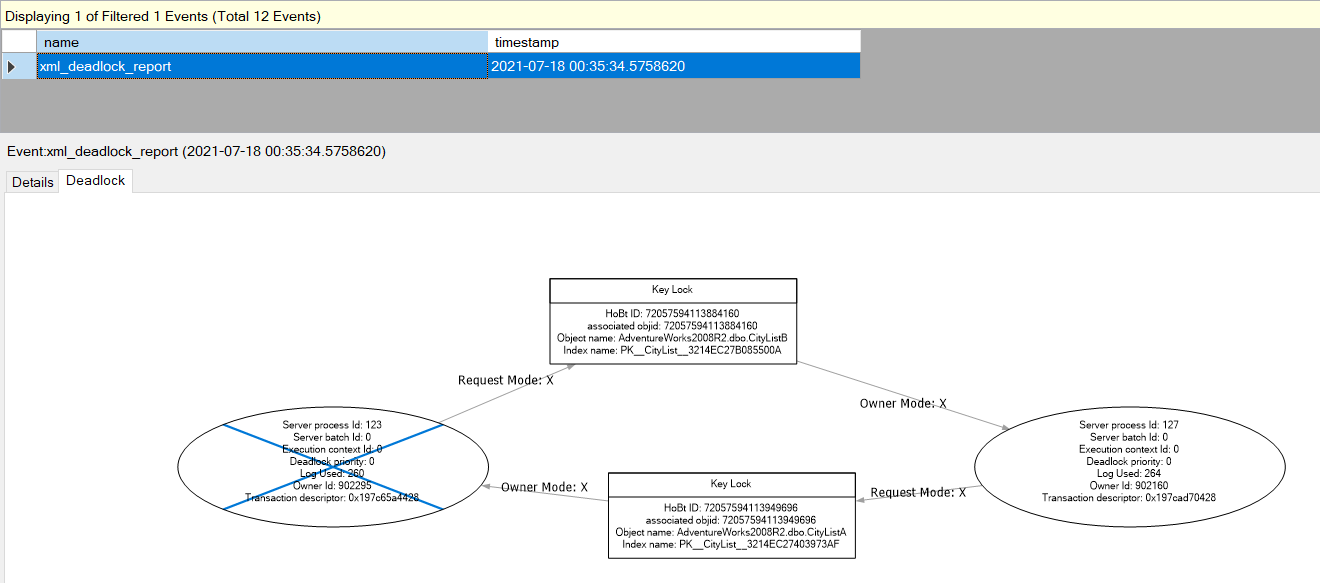
6.1 Pros
- Performance impact: Extended Events are designed to have a minimal effect on performance, which is crucial for a high-performance database engine.
- Flexibility: It permits users to collect only the data they need, helping to minimize data storage demands.
- Coding customization: It provides the possibility of adding custom-coded responses to specific events, further extending its usefulness.
- Range of events: It provides a much wider range of events to track compared to SQL Server Profiler.
6.2 Cons
- Complexity: With its increased flexibility comes increased complexity; it might take some time to fully understand and use properly.
- UI: The user interface may not be as intuitive as other DBA tools.
- Learning curve: New users may experience a steep learning curve due to a multitude of options and customizability.
7. Live Query Statistics (LQS)
Live Query Statistics is a feature provided by Microsoft, allowing the tracking of query execution, helping in understanding and optimizing complicated queries.
Live Query Statistics (LQS) provides real-time insights into query execution in SQL Server, providing a direct way to monitor the runtime characteristics of a query. With LQS, you can see the number of rows processed, elapsed time, and other vital details of running queries. It is an integral part of SQL Server Management Studio and is particularly useful when dealing with complex and time-consuming queries.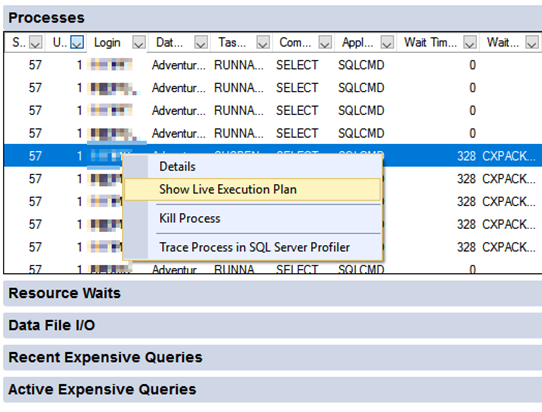
7.1 Pros
- Real-time insight: LQS allows you to view the query execution as it’s happening, enabling immediate identification of any bottlenecks.
- Execution plan: Visual representation of the execution plan provides a great way to understand the more complex queries.
- Seamless integration: As an integral part of SQL Server Management Studio, using Live Query Statistics does not require any additional setup or configuration.
- Improving query performance: Real-time analytics helps in understanding the query performance and identifying optimization opportunities.
7.2 Cons
- Performance Impact: Live Query Statistics may result in a slight performance impact as it collects execution statistics in real-time.
- No historical information: LQS does not store or provide any historical performance data.
- Limited filter options: It does not provide as many filter options for viewing data as other tools.
8. Open Activity Monitor SQL Server Management Studio (SSMS)
Open Activity Monitor is a function embedded within SQL Server Management Studio that assists in monitoring ongoing SQL Server processes and how these are affecting the overall performance.
Open Activity Monitor in SQL Server Management Studio (SSMS) is a helpful tool that provides an overview of SQL Server operations and processes. It displays information about processor time, waiting tasks, database I/O, and batch requests, among other useful data. These performance-monitoring attributes provide invaluable insights to DBAs for troubleshooting and optimizing SQL Server performance.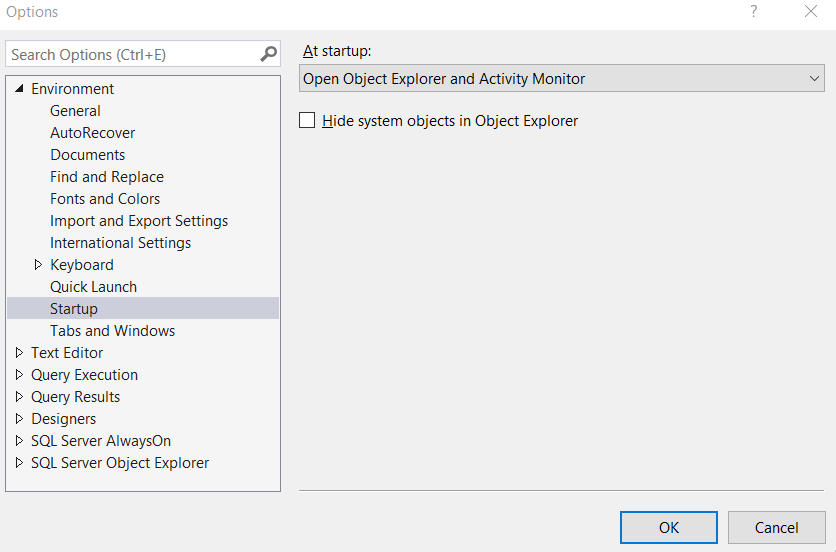
8.1 Pros
- Real-time monitoring: Offers real-time data about system performance, current users, sessions, and operations.
- Easy access: Being embedded in SSMS, it is quickly and easily accessible.
- Functional simplicity: Though powerful, it is simple to operate even for SQL Server newcomers.
- Detailed view: Provides a detailed view of running tasks, resource consumption, and database operation speeds.
8.2 Cons
- User interface: The user interface can be a bit overwhelming for beginners.
- Impact on performance: Continually running Activity Monitor could slightly impact the server performance.
- No historical information: Information is real-time only, and there is no option to store activity history.
9. Query Tuning Assistant
Query Tuning Assistant is a performance tuning feature from Microsoft, intended to advise on optimizing database compatibility scenarios.
Query Tuning Assistant (QTA) is a tool provided by Microsoft as part of the SQL Server Management Studio for assisting database administrators in performance tuning and query optimization tasks. The tool is intended to monitor queries over time, and identify plans or queries that would benefit from optimization and tuning, making it a valuable assistant for long-term performance monitoring.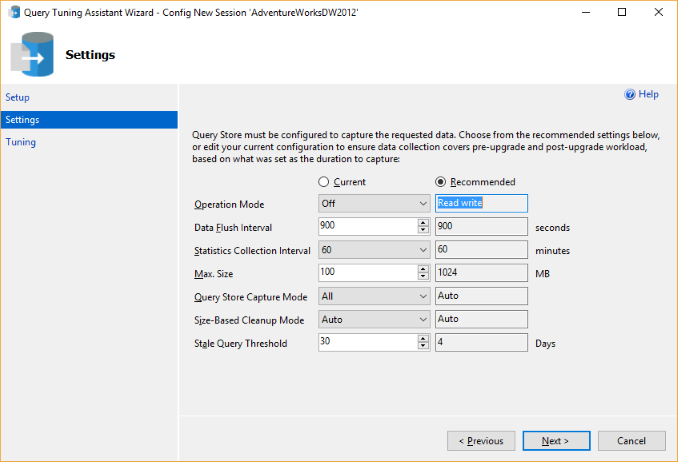
9.1 Pros
- Upgrade support: QTA assists in maintaining database compatibility during upgrades and prevents performance regression.
- Automated Recommendations: It provides database administrators with query tuning recommendations automatically, saving valuable time and effort.
- Monitoring: It monitors performance over time, which helps to highlight changes or anomalies.
- Easy Integration: As a part of SQL Server Management Studio, it integrates well with other built-in tools.
9.2 Cons
- Learning curve: QTA might be complex for new or less-experienced users.
- Scope limitation: It mainly focuses on preventing performance issues after an upgrade or migration, making it less useful for real-time monitoring.
- No real-time alerts: QTA lacks real-time alert functionalities unlike some other monitoring tools.
10. SolarWinds SQL Server Monitoring Tool
SolarWinds offers a SQL Server monitoring tool to assist businesses of various sizes manage database operations effectively.
The SolarWinds SQL Server Monitoring Tool, also known as SQL Sentry, is designed to diagnose, solve, and prevent serious performance issues with SQL Server. It provides unrivaled visibility, scalability, and configurability for the most demanding SQL Server environments. Its powerful features help database administrators to maintain optimal performance of their databases via comprehensive and proactive monitoring.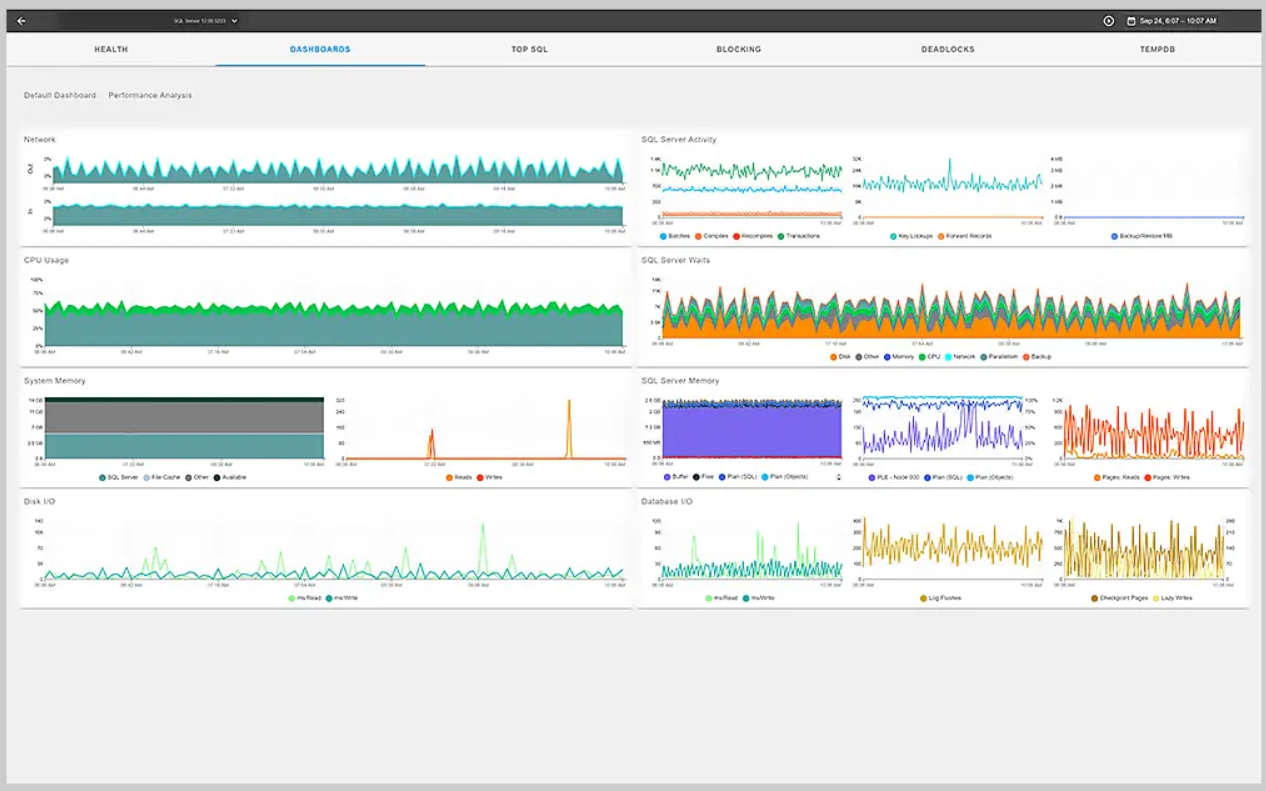
10.1 Pros
- Granular detail: It provides detailed metrics and measurements for SQL server operations.
- Real-time monitoring: It conducts live monitoring of SQL Server performance, ensuring to pick up on any issues as and when they emerge.
- Visual aid: SolarWinds SQL Server Monitoring Tool includes visual aids like charts and graphs, which greatly assists in data interpretation.
- Alerting system: It has a sophisticated alerting system that notifies users on a predefined set of conditions.
10.2 Cons
- Pricing: While it offers a broad range of functionalities, its cost might be prohibitive for smaller organizations.
- Resource-consuming: The tool can be resource-intensive, and might affect other server operations particularly on less powerful hardware.
- Complexity: While it offers robust features, the tool can be complex to new or less profuse users.
11. Redgate SQL Server Monitor
Redgate provides a SQL Server Monitor that makes it easy to monitor SQL Server performance in real time.
Redgate’s SQL Server Monitor is a comprehensive monitoring solution for DBAs, developers, and SQL Server professionals. This tool helps detect and solve performance problems in SQL Server by providing a wide range of metrics and data in real time. From highlighting slow-running queries to CPU pressure, you get a unified view of all your SQL servers, allowing you to ensure performance and solve issues before they become problems.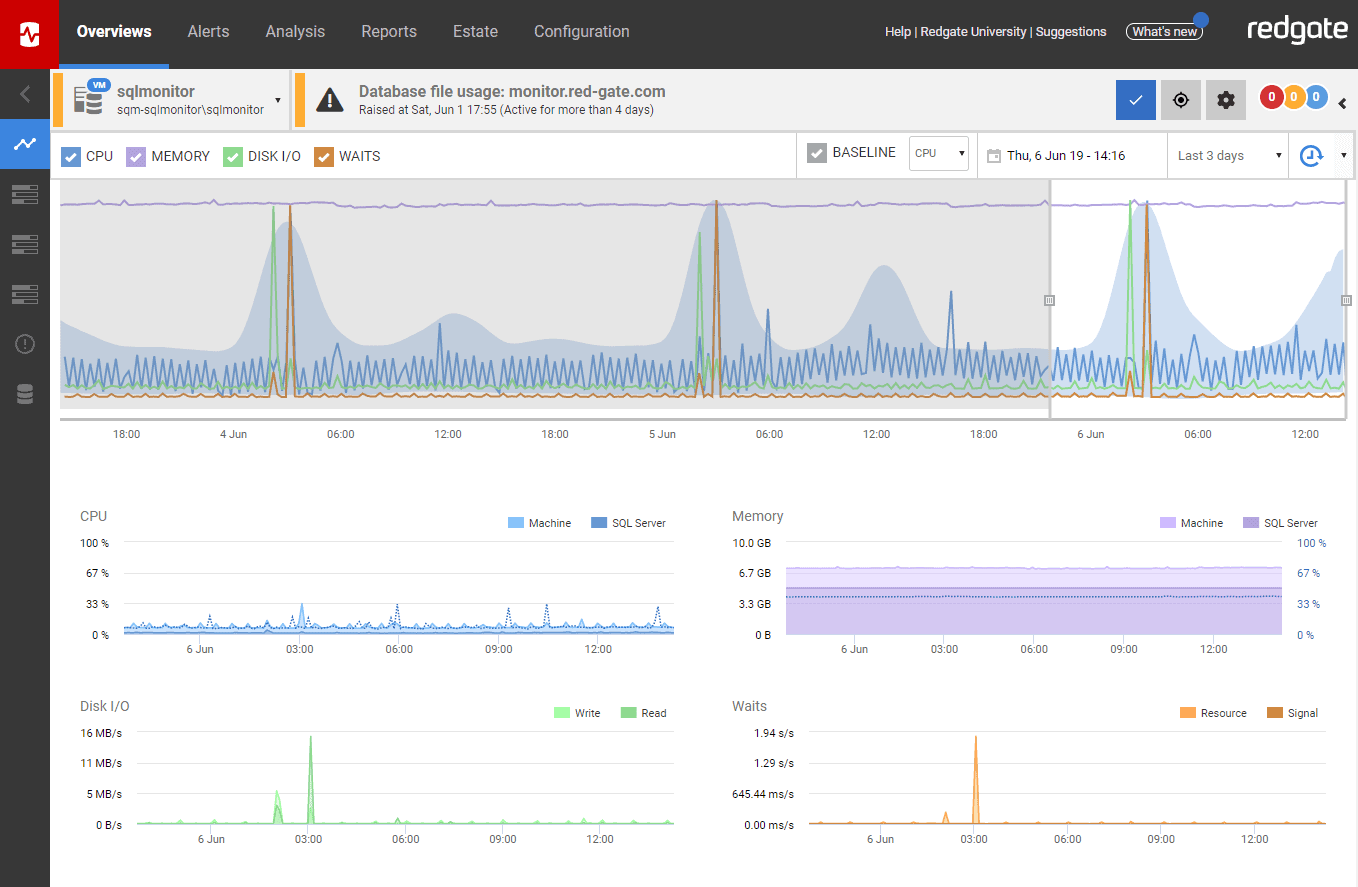
11.1 Pros
- User-friendly Interface: It offers a clean and intuitive interface that is easy to navigate, even for those new to SQL Server monitoring.
- Proactive alerting: The tool offers automatic alerts for potential issues which can be customized to your preference.
- Performance diagnostics: It provides robust diagnostic information including wait stats and query performance.
- Server overview: It provides a holistic server and database performance overview which assists in fast-tracking problem identification and resolution.
11.2 Cons
- Price: Redgate’s SQL Server Monitor can be expensive, especially when managing several servers.
- Complex for first-time users: Some users consider it to be complicated to set up and operate initially.
- Limited integration: Integration with non-SQL Server databases or third-party tools is limited.
12. SQL Power Tools
SQL Power Tools is a software suite designed to enhance SQL Server performance, ensuring optimal database performance and accessibility.
SQL Power Tools is a full-featured suite that provides essential diagnostics, monitoring, and performance tuning capabilities to SQL Server DBAs and developers. It enables you to monitor SQL Server performance in real time, provides comprehensive performance tuning, database bottleneck analysis, and deadlock detection to ensure optimal SQL Server performance. With SQL Power Tools, you receive the tools and features necessary to maintain the health and speed of your SQL Server environment.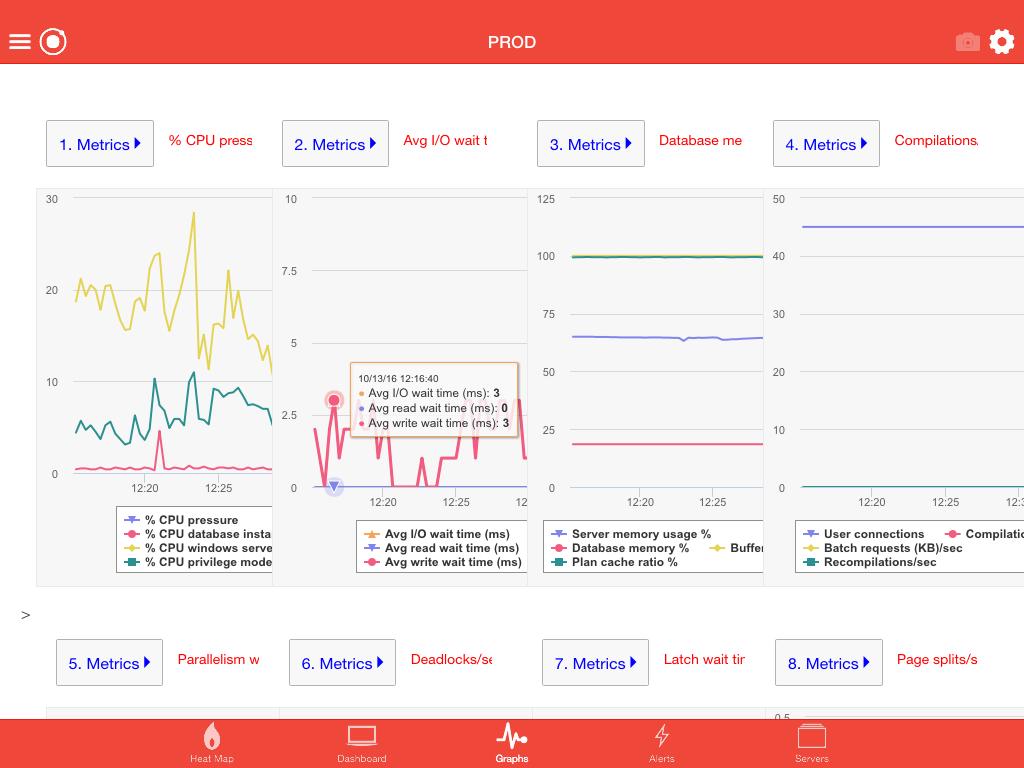
12.1 Pros
- Comprehensive monitoring: It provides detailed performance data, bottleneck identification, deadlock detection, and other crucial analytics.
- Flexible alerting system: Its robust alert system can notify the DBA via email, pager, texting, or executing a program when performance thresholds are surpassed.
- Extensive diagnostic tools: Offers built-in utilities for examining SQL Server performance issues deeply.
- Security features: It helps maintain database security with auditing features and intrusion detection functionality.
12.2 Cons
- Complexity: The plethora of features can be overwhelming and confusing for new or inexperienced users.
- Learning curve: To fully utilize the suite of tools, there is a significant learning curve.
- Cost: Depending on the specific needs and scale of use, SQL Power Tools might be an expensive option.
13. IDERA’s SQL Server Performance Monitoring Tool
IDERA SQL Diagnostic Manager is a powerful SQL Server performance monitoring tool designed to assist with proactive performance monitoring, diagnostics, and tuning. It provides a robust alert and response system, allowing admins to implement measures before small problems grow into larger, potentially harmful issues.
13.1 Pros
- Real-time and historical monitoring: The tool provides insights into what is happening in your SQL Server environment right now and also stores historical data for trend analysis and long-term planning purposes.
- Powerful alert system: You can customize alerts for critical or warning conditions and even automate responses to predetermined situations, freeing up staff for other tasks.
- Capacity planning tools: The IDERA SQL Diagnostic Manager makes it feasible to perform predictive analysis and future-proof your SQL Server environment.
13.2 Cons
- Usability learning curve: New users may find the interface overwhelming at first, and it could take some time to figure out where everything is and how it works.
- Cost: Compared to other products on the market, IDERA’s tool can be slightly on the pricier side. Organizations on a tight budget might find it difficult to fit this into their spending plan.
- Limited support for other DBMS: While it is a robust tool for Microsoft SQL Server, it provides limited support for monitoring other database management systems, which can be a drawback for environments with multiple different DBMS.
14. SolarWinds SQL Sentry
SolarWinds SQL Sentry takes a holistic approach towards monitoring an entire SQL Server environment. It focuses on providing end-to-end visibility into the performance and health of your SQL Server landscape. The tool offers comprehensive database monitoring, performance data collection, analysis and visualization so you can quickly identify and rectify any issues.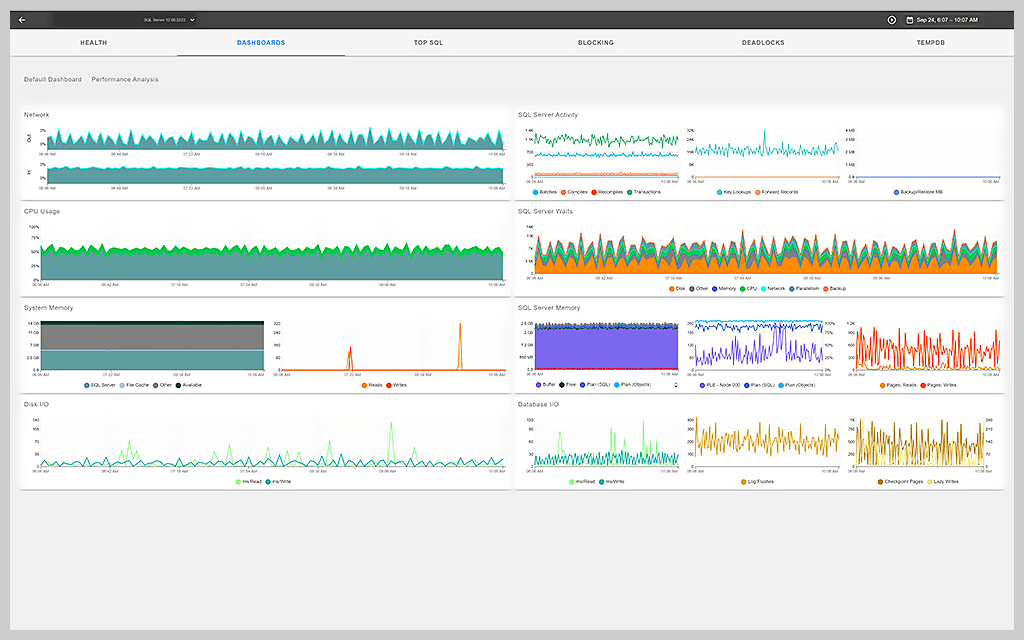
14.1 Pros
- Comprehensive Monitoring: SQL Sentry provides broad, detailed visibility into the SQL Server environment, from query performance to server resources, offering a one-stop solution for monitoring needs.
- Actionable Insights: The tool goes beyond raw data collection, converting data into digestible, actionable insights. The advisory conditions engine suggests actions based on the identified issues.
- Scalability: SolarWinds SQL Sentry scales effectively with your environment, making it an excellent option for large enterprises or fast-growing companies.
14.2 Cons
- Complex interface: Some users find the interface to be a bit complex and not the most user-friendly, and it may take some time to fully grasp all the features and functions of the tool.
- Cost: Similar to IDERA, SolarWinds SQL Sentry can be an expensive option, especially for smaller organizations with limited budgets.
- Heavy system requirements: Due to its comprehensive monitoring capacities, SQL Sentry can put considerable load on system resources, which could be a possible drawback for environments with limited resources.
15. Netwrix Auditor for SQL Server
Netwrix Auditor is a SQL Server monitoring tool developed with a focus on database security. It provides complete visibility into changes in your SQL Server environment, including modifications to database structure, contents, and configurations. Impressively, it also stores historical data for forensic analysis and compliance purposes.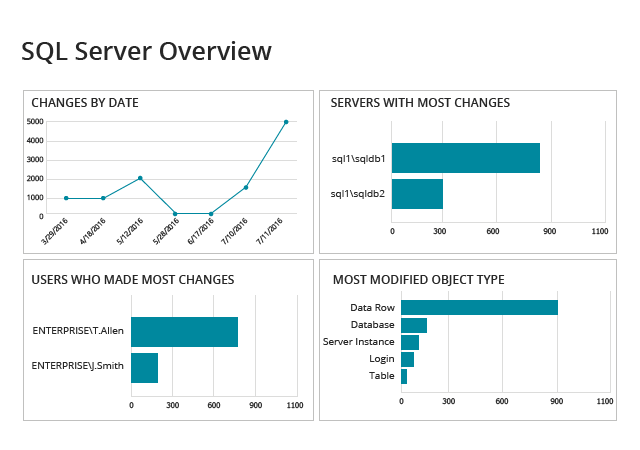
15.1 Pros
- Strong Security Emphasis: Offers detailed change auditing for security and compliance, allowing you to easily track and investigate unauthorized changes or access.
- Highly Detailed Reporting: Netwrix Auditor provides incredibly clear and detailed reporting options, essential for compliance and risk management.
- Long-term Data Storage: Its data archiving feature stores historical data, useful in forensic investigations, trend analysis, and troubleshooting.
15.2 Cons
- Limited Performance Monitoring: While excellent for security auditing, it doesn’t offer as comprehensive performance monitoring features as some of the other tools on this list.
- Requires Additional Learning: Due to the depth of features available, users may require additional training to make full use of the software.
- Higher Pricing: Similar to other top-tier solutions, Netwrix Auditor can be expensive, especially for smaller organizations or those on a tighter budget.
16. Paessler SQL Monitoring Software PRTG
Paessler PRTG is an all-round monitoring solution that covers various aspects of your IT infrastructure, including SQL Server monitoring. It provides in-depth monitoring of your SQL Server’s statuses, including disk usage, CPU load, memory use and the successful execution of your SQL queries.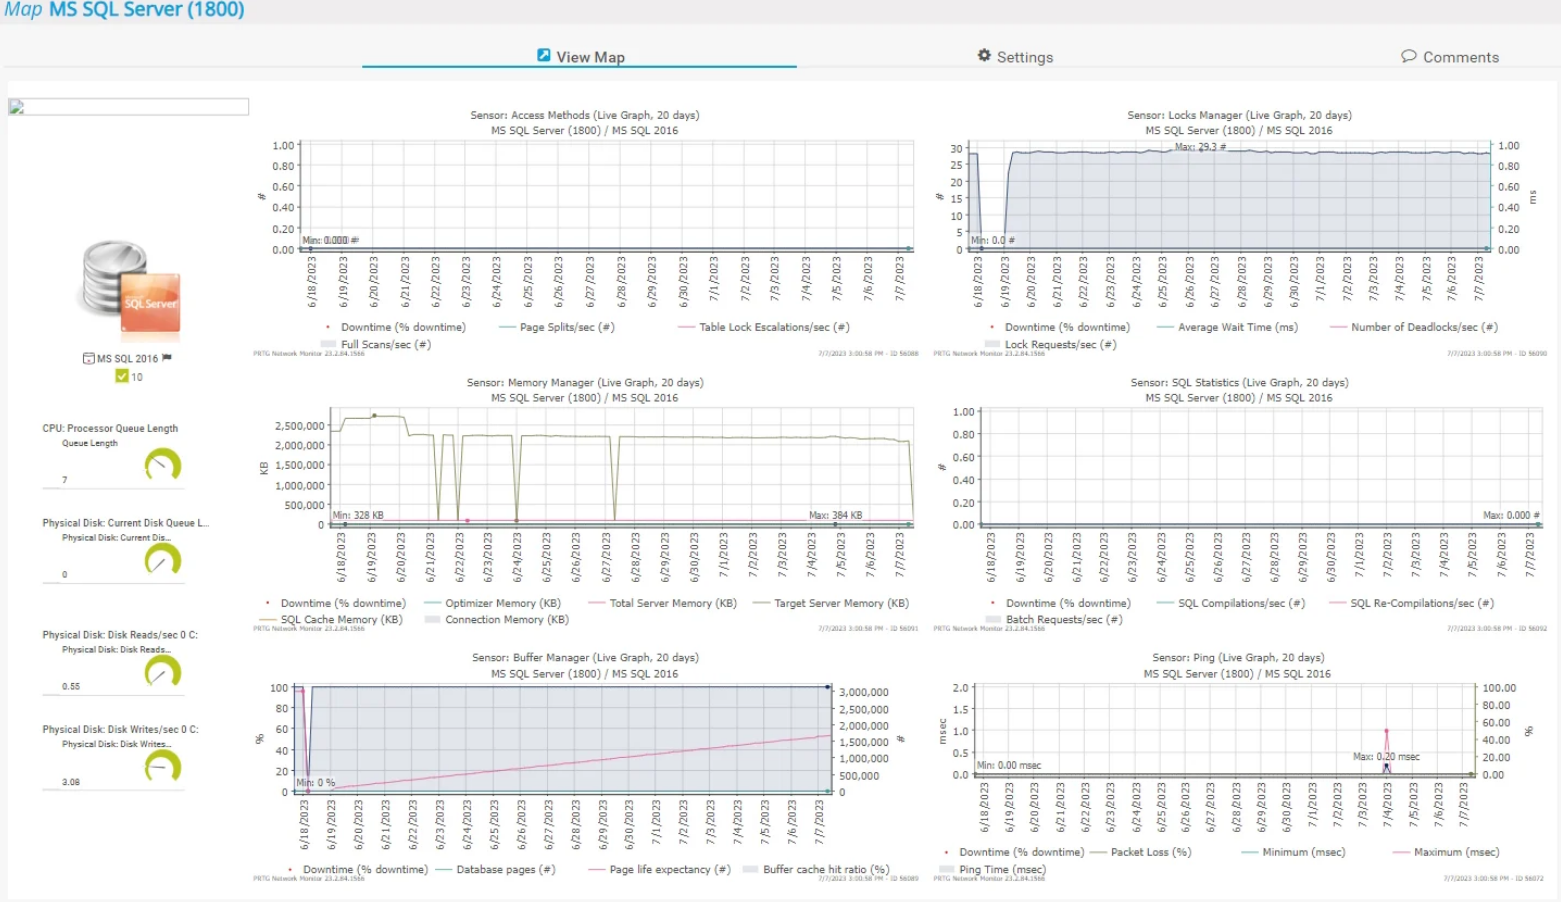
16.1 Pros
- Versatile Monitoring: It doesn’t just monitor SQL Server but a vast range of IT infrastructure, making it a one-stop solution for all your monitoring needs.
- Alert Flexibility: PRTG notifies you when it detects a threshold breach through various means like email, push notifications or even executing http requests, giving you a range of options for immediate response.
- Easy-to-use Interface: PRTG has an intuitive and user-friendly interface, making it easier for users to leverage its capabilities.
16.2 Cons
- Limited Depth in SQL Server Monitoring: While PRTG is a robust all-around monitoring tool, it doesn’t offer as intensive SQL Server monitoring as more specialized tools might.
- Setup Can Be Complex: Setting up PRTG, especially in larger environments, can be somewhat complex due to the diversity of its monitoring abilities.
- Cost Increases with Sensors: Each sensor, or monitoring node, comes at a cost. So monitoring a large variety of metrics across a sprawling IT infrastructure can quickly become expensive.
17. Site24x7 SQL Server Monitoring
Site24x7 SQL Server Monitoring is a SaaS-based solution offering a comprehensive view of your SQL Server’s operational status and performance. It primarily helps detect bottlenecks, assist in database regression and in managing the overall SQL Server health.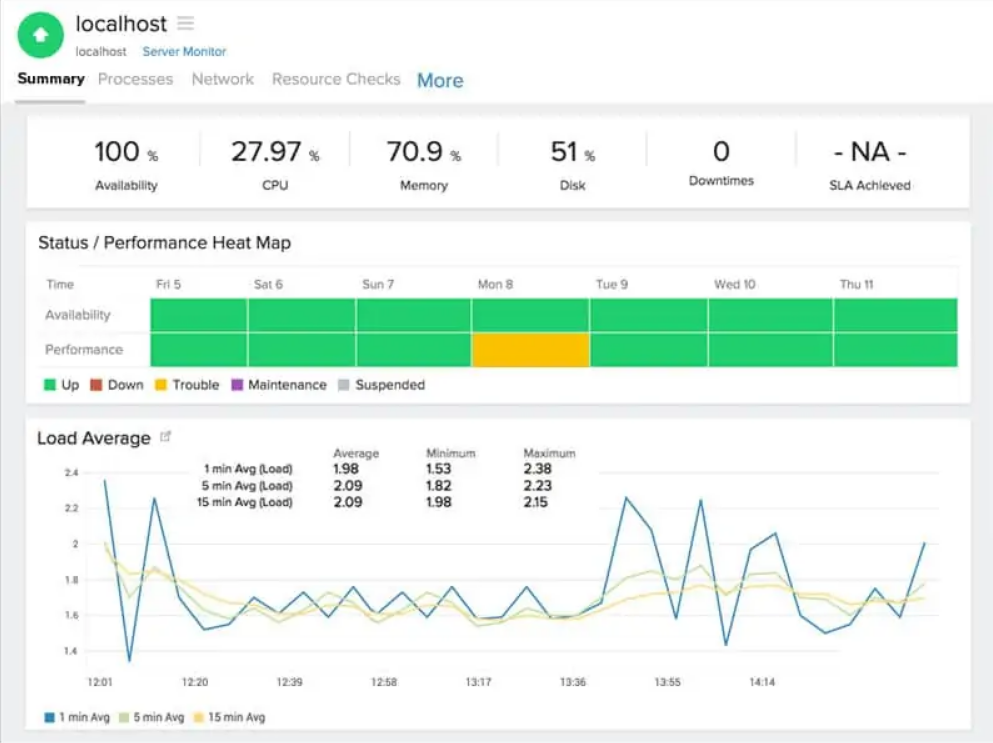
17.1 Pros
- Cloud-Based: Being a SaaS solution, it’s accessible from anywhere, making remote monitoring a breeze.
- Alert Mechanism: It incorporates a smart alerting module that sends out notifications based on threshold breaches, escalating them based on their urgency.
- Comprehensive Reporting: The tool offers detailed performance reports, assisting in trend analysis and capacity planning.
17.2 Cons
- Lacks High-Level Analysis: While it performs routine monitoring well, it might fall short for highly specialized tasks requiring in-depth analysis and diagnostics.
- Delayed Updates: As it’s cloud-based, server data may not be real-time and there could be a slight delay in reflecting actual data.
- Additional Charge for Advanced Features: Some advanced features come with extra charge, which can increase total cost of ownership over time.
18. Acronis Cyber Protect Cloud
Acronis Cyber Protect Cloud takes a holistic approach to safeguarding your database environment. It focuses on the integration of data protection, cybersecurity, and endpoint management into a single solution. Though it’s not a dedicated SQL Server monitoring tool, it does provide monitoring capabilities as part of its suite of protection services.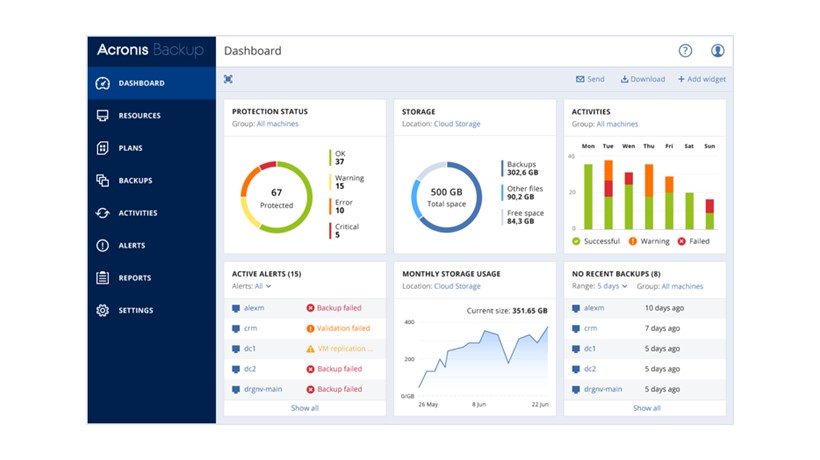
18.1 Pros
- Integrated Protection Platform: It offers data protection, cybersecurity and system management within one platform, making it handy for those seeking an all-in-one solution.
- AI-based Protection: Acronis leverages artificial intelligence in its threat detection, offering proactive defenses against database threats.
- Cloud-Based and Scalable: It is a cloud-native solution, allowing for anywhere-access and scalable resource allocation based on your data requirements.
18.2 Cons
- Limited Monitoring Capabilities: As it’s not a dedicated SQL Server monitoring tool, its features may not be as extensive compared to specialized solutions.
- Steep Learning Curve: With several different functionalities contained within the same platform, users may find it complex to navigate and make full use of its capabilities.
- Pricing: Depending on your needs, the cost of leveraging all its functionalities can be high.
19. Datadog SQL Server Monitoring
Datadog SQL Server Monitoring allows you to gain end-to-end visibility into your SQL Server environment. It is designed to collect, visualize, correlate, and alert on performance data from your servers and databases in real-time, and it comes with out-of-the-box dashboards for instant insights.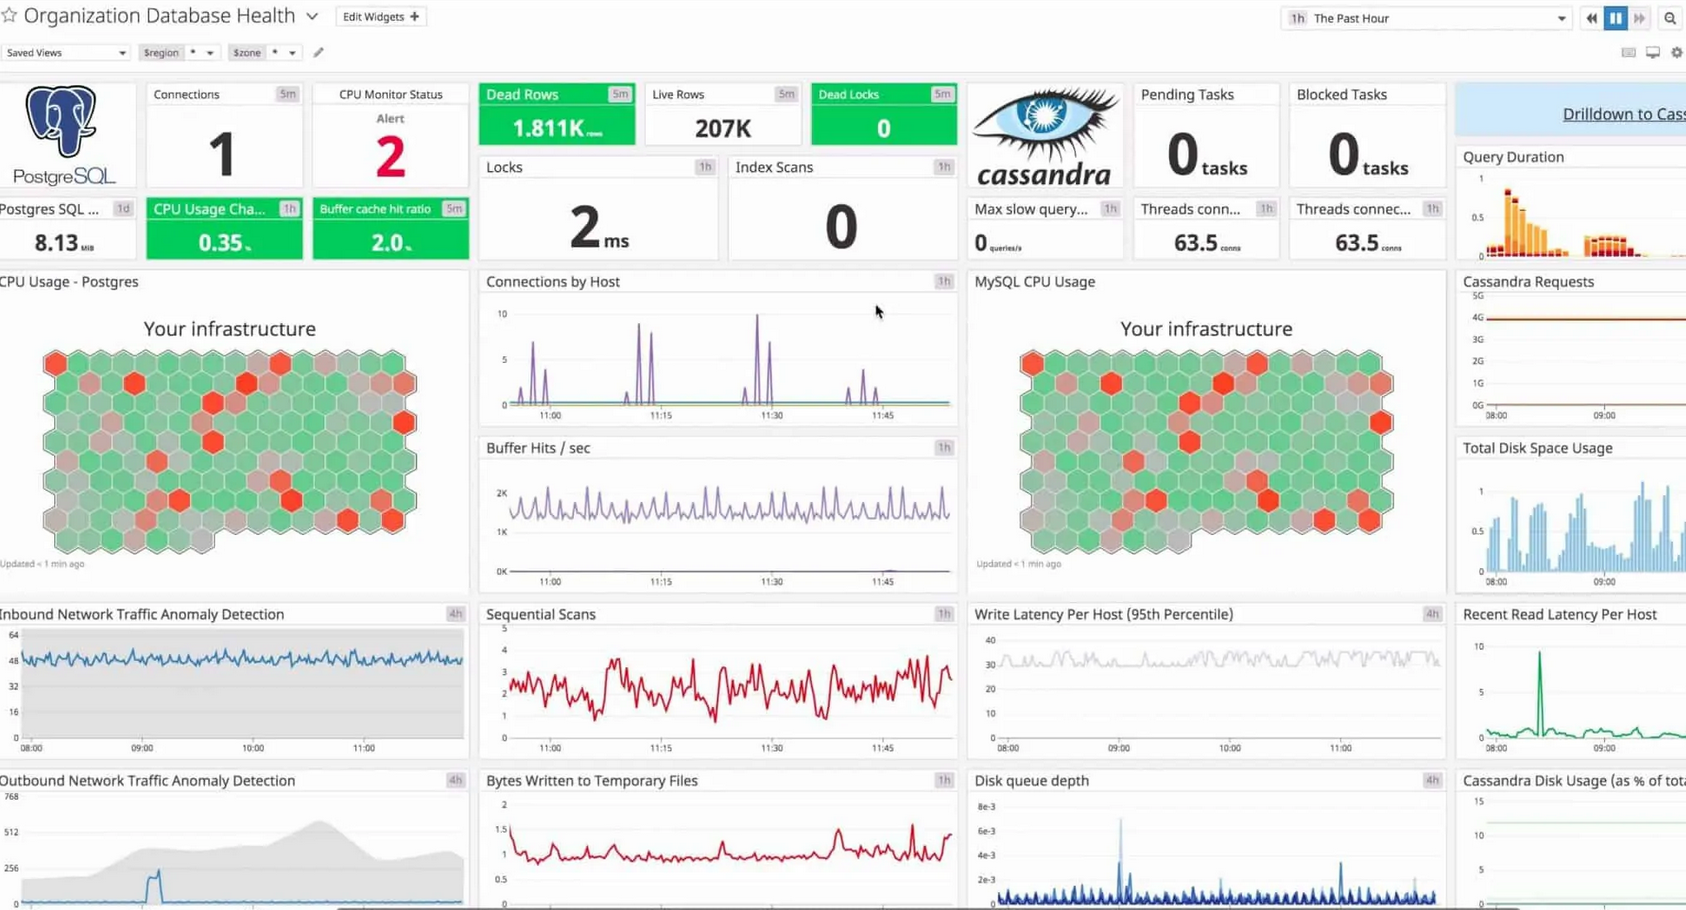
19.1 Pros
- Real-time Monitoring: It offers real-time insights into your SQL Server performance, helping you to identify and resolve issues swiftly.
- Easy Integration: Datadog can be integrated with a wide variety of other tools and services, providing comprehensive coverage across your entire tech stack.
- Scalability: It is built with scalability in mind, hence it is suitable for monitoring large and growing environments.
19.2 Cons
- Advanced Configuration Requires Expertise: To take full advantage of all features, you may need an experienced system administrator.
- Costs can Stack Up: Though it offers a base price, additional costs for more complex requirements can make the total cost quite hefty.
- Alert Deluge: Some users have reported an overload of alerts which might lead to the overlooking of critical issues.
20. CheckMK MySQL Performance Monitoring
Although not exclusively an SQL Server tool, CheckMK offers extensive database monitoring capabilities, including for SQL Server. It’s a comprehensive solution used for monitoring a variety of servers and applications, networks, and infrastructure, in both cloud and on-premise environments.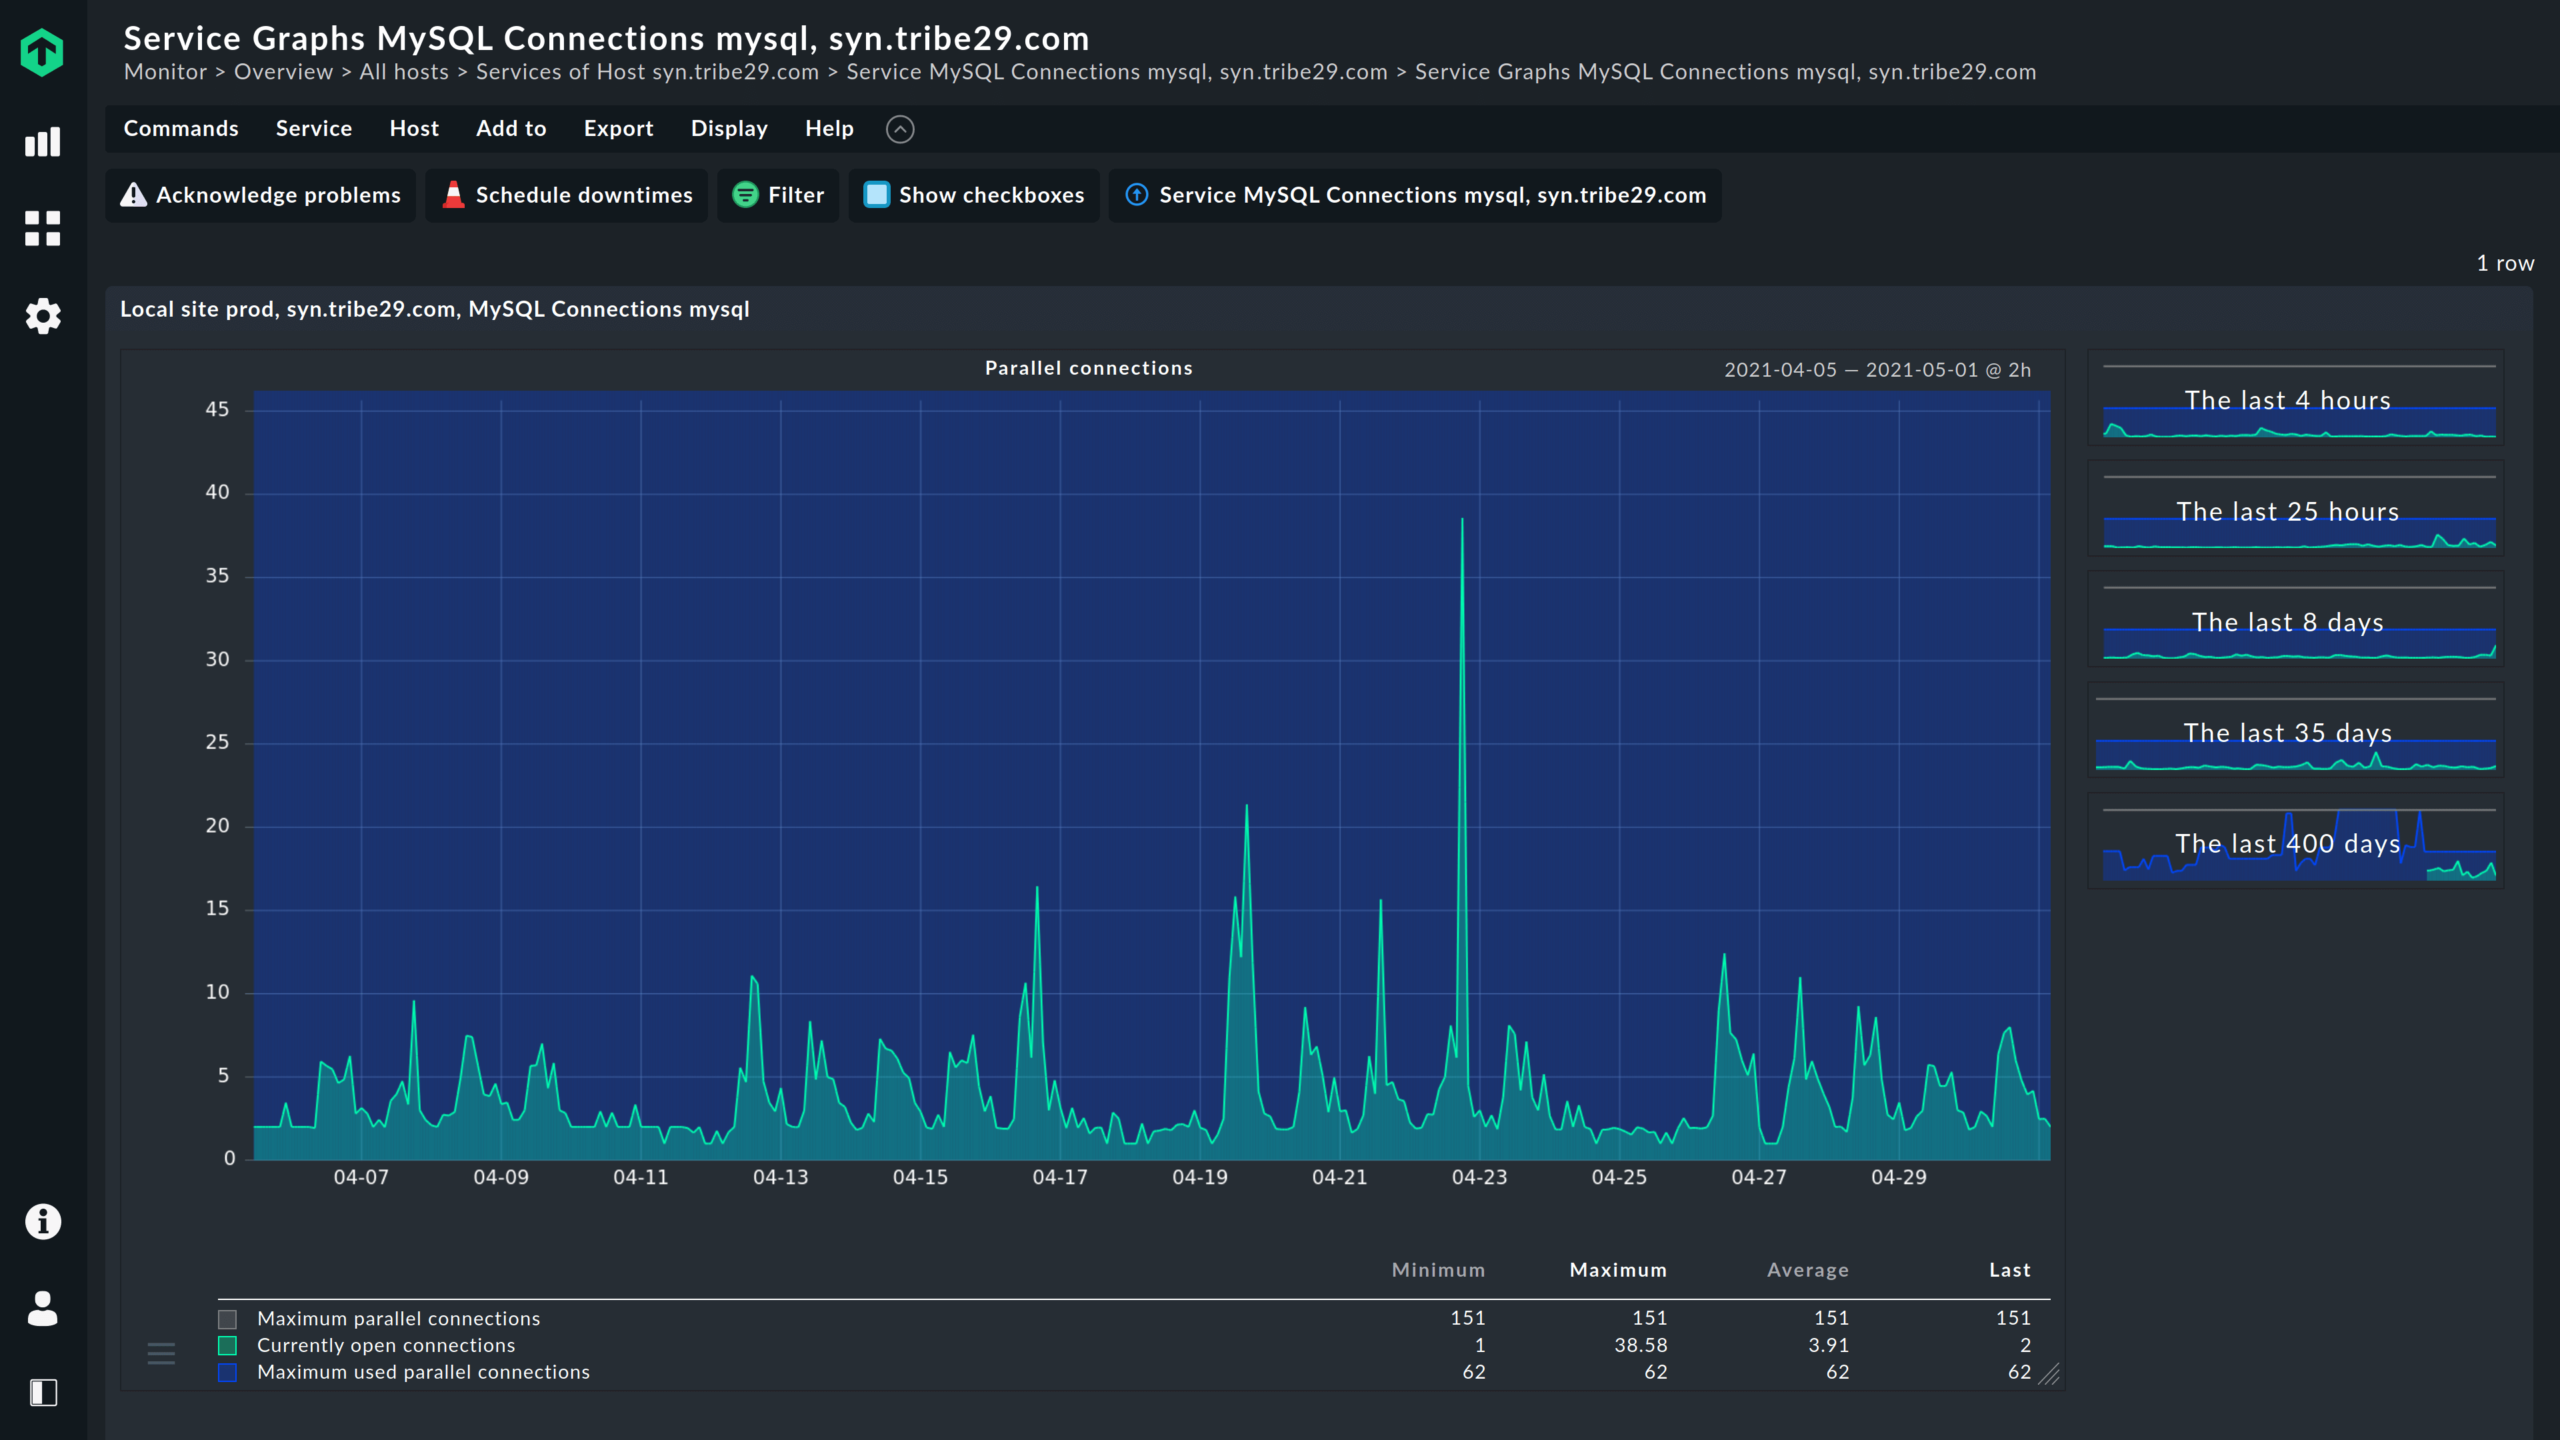
20.1 Pros
- Wide Range Monitoring: CheckMK’s toolbox includes capabilities for monitoring servers, applications, networks, and even cloud infrastructure, offering wide coverage.
- Customizable: It’s highly customizable, allowing you to create your own metrics and adjust threshold values for notifications and alerts as needed.
- Unified View: It provides a unified monitoring view, aggregating all monitored components in a comprehensive dashboard.
20.2 Cons
- Complex Setup: The initial setup and configuration can be complex, particularly for those new to the tool.
- Interface: Some users report the interface as not very intuitive, which can make it harder for new users to learn how to use it effectively.
- Support Limited: While technical support is available, it can sometimes take longer to get a response, which could cause delays when trying to fix problems or optimize settings.
21. dbWatch SQL Server Monitoring and Management
dbWatch SQL Server Monitoring and Management is a comprehensive tool used to manage SQL Server databases at scale. Equipped with advanced features, it provides effective monitoring as well as management capabilities for SQL Server environments of all sizes.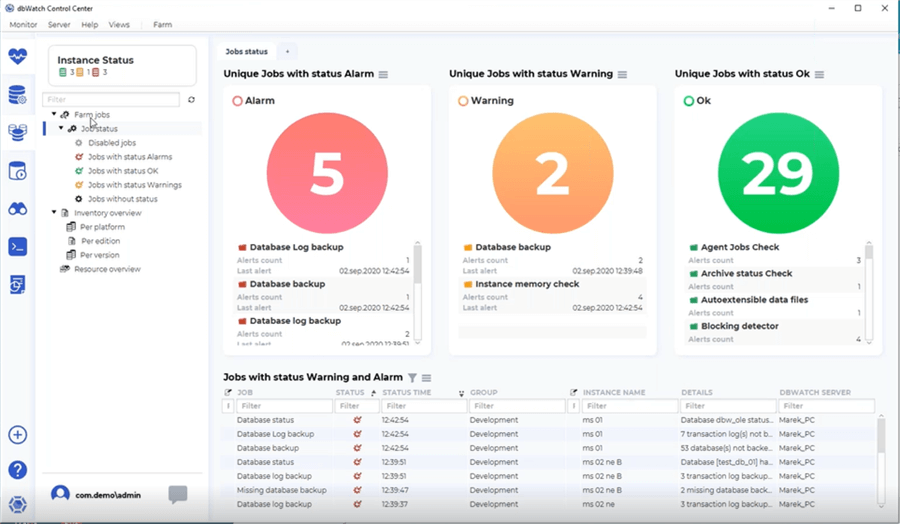
21.1 Pros
- Scalability: The tool is designed to handle an extensive number of SQL Server instances, catering to a wide range of businesses, from SMEs to large enterprises.
- Detailed Reports: It provides in-depth reports with a snapshot overview and detailed information about the status of your servers and databases.
- Health Checks: It offers regular health checks ensuring your servers perform optimally.
21.2 Cons
- Limited Dashboard Customization: The dashboard lacks customization capabilities, which may restrict how users aggregate and view their data.
- User Interface: Some users report the user interface to be complex and less user-friendly compared to other tools.
- Technical Support: While dbWatch offers support, feedback from users suggests that it can be slow, which can be troublesome if you run into a critical issue.
22. AimBetter SQL Server Monitoring
AimBetter SQL Server Monitoring is a cloud-based solution that delivers a holistic overview of your SQL Database environment. Aimed at improving overall operational efficiency, it provides real-time monitoring, historic data analysis, and proactive alerting.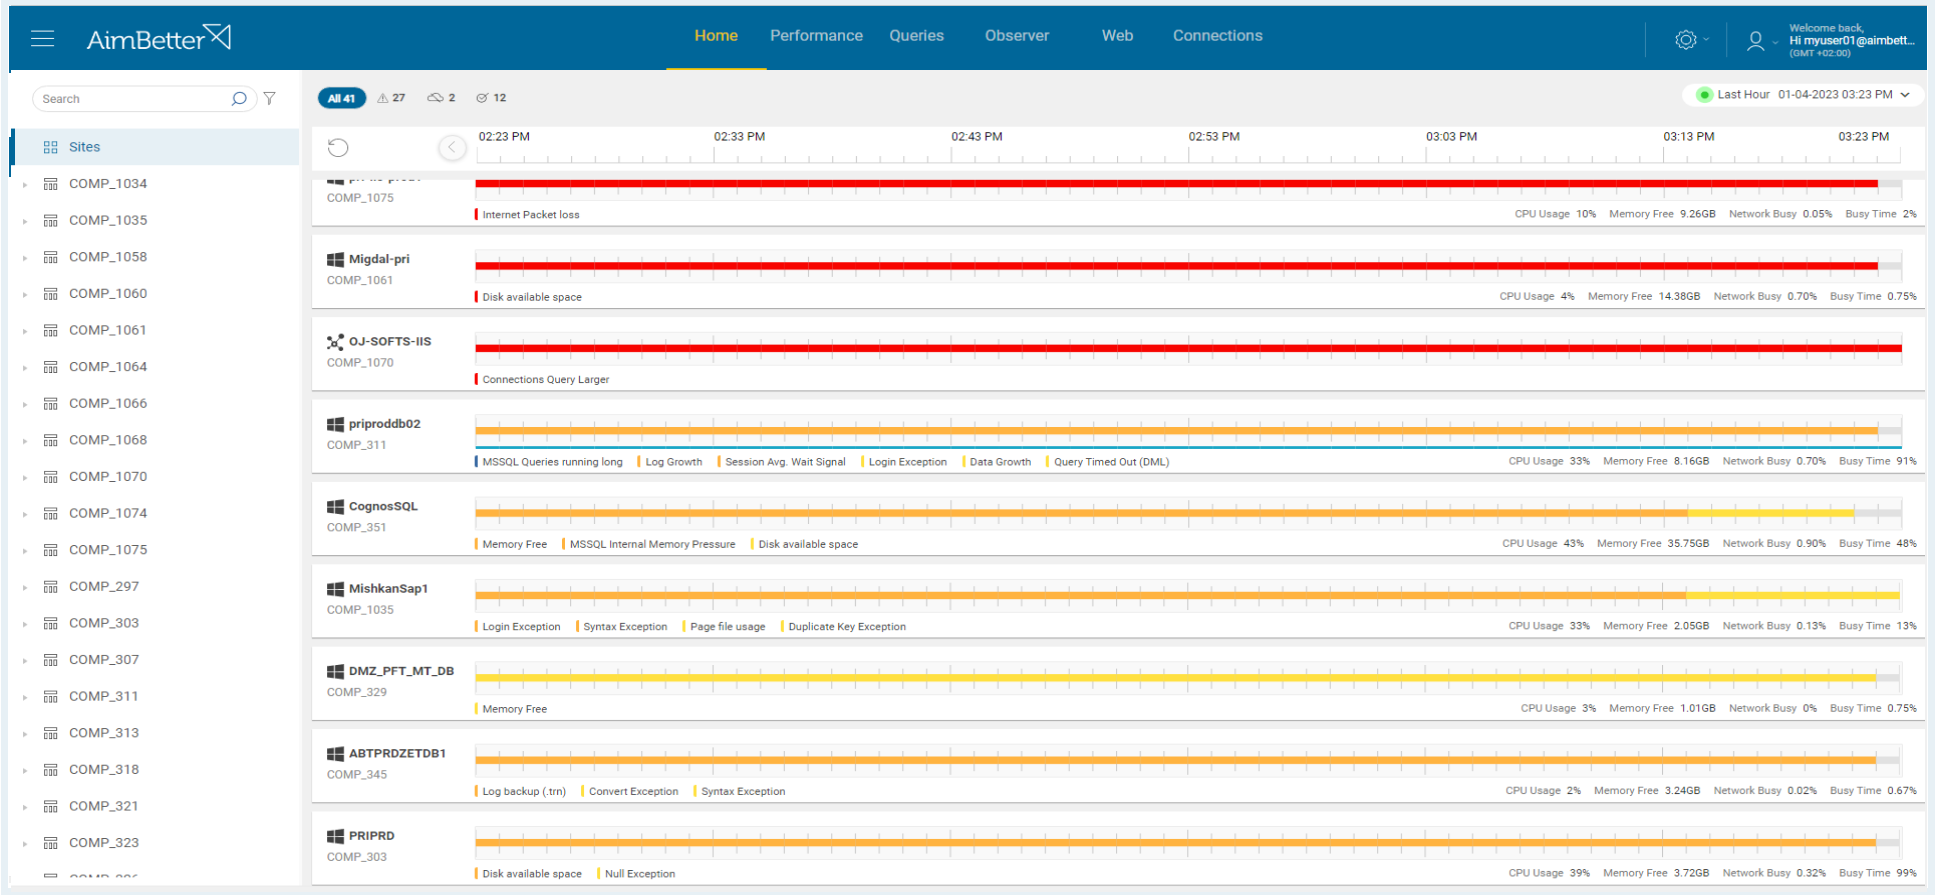
22.1 Pros
- Cloud-Based: Enables easy remote access and reduces on-premise infrastructure and maintenance costs.
- Proactive Alert System: Provides real-time notifications with predictive analysis which helps take proactive stances towards issue resolution.
- User-Friendly: Features an intuitive interface and easy configuration which requires minimal technical expertise.
22.2 Cons
- Limited Integration: As of now, it might not integrate well with various third-party applications which could possibly limit functionality in more diverse tech environments.
- Data Latency: Being a cloud-based solution, there can be a slight delay in data pushing from the server to the cloud, causing minor latencies.
- Pricing: Depending upon the scale of use and extra features, cost can be on the higher side.
23. Lepide SQL Server Auditing
Lepide SQL Server Auditing is a tool specifically designed for comprehensive auditing of your SQL Server environment. It focuses on providing in-depth insights into who, what, when and where about changes made to the server, allowing you to monitor user behavior, detect anomalies and ensure compliance.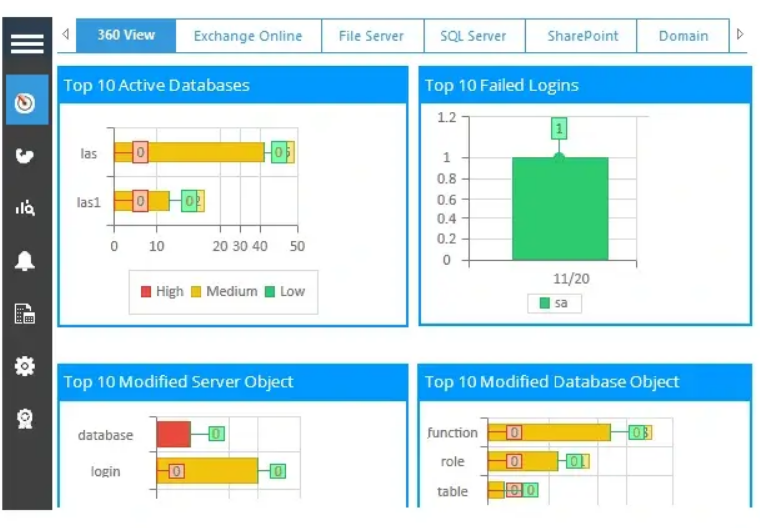
23.1 Pros
- Extensive Auditing: The tool provides detailed change auditing which helps in maintaining an audit trail for compliance purposes.
- Permission Analysis: It facilitates analysis of permissions and permission history, providing insights into user access and activities.
- Efficient Reporting: Lepide offers easy-to-understand reports, alerts and real-time updates ensuring effective management of your SQL Server environment.
23.2 Cons
- Specific Focus: Its strength lies in auditing, not monitoring, which means it might lack in providing thorough real-time or performance monitoring capacities.
- User Interface: While not problematic, the user-interface could be more user-friendly and intuitive for a more effortless experience.
- Pricing: As with other specialized tools, Lepide can also be on the costlier side, especially for small and mid-sized businesses.
24. virtualMETRIC Microsoft SQL Database Monitoring
virtualMetric offers a comprehensive monitoring solution for Microsoft SQL databases. This tool delivers real-time and historical analytical data about your SQL Server‘s performance, assisting in the proactive management of your server environment.
Designed with a user-friendly interface, virtualMetric’s SQL Database Monitoring tool constantly surveys your database infrastructure, providing insights that not only ensure optimal performance but also help diagnose and rectify issues as they occur. With features like advanced reporting, alert management, and predictive analytics, it provides a 360-degree view of your SQL database environment.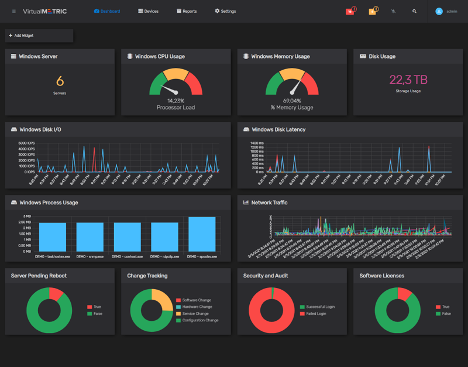
24.1 Pros
- Real-time Monitoring: offers real-time tracking of database activities, aiding immediate detection of potential issues.
- Predictive Analytics: utilizes advanced algorithms to forecast possible issues or downtimes, allowing preventative measures to be taken.
- Comprehensive Reporting: generates detailed reports concerning database performance, usage, and availability, aiding in informed decision-making.
- Easy-integration: can easily integrate with other IT infrastructure for a holistic view of operations.
24.2 Cons
- Lack of Training Materials: the availability of online learning resources or detailed guides is limited, making it harder for novice users to get on board.
- Interface Complexity: while the user interface is robust, it can be complex and overwhelming for beginners.
- Pricing: may be considered on the higher end of the spectrum when compared to other similar tools in the market.
25. LogicMonitor Microsoft SQL Server Monitoring
LogicMonitor is a cloud-based platform that offers robust functionality for monitoring Microsoft SQL Server performance. It is known for its comprehensive set of features that allow for in-depth database monitoring and management.
Incorporating coverage for various versions of Microsoft SQL Server, LogicMonitor provides everything from basic metrics to detailed transactional and operational data. It streamlines identifying, troubleshooting, and preventing potential issues within your SQL Server environment. By utilising powerful alerting and forecasting features, LogicMonitor aids in maintaining your databases’ operational efficiency and reliability.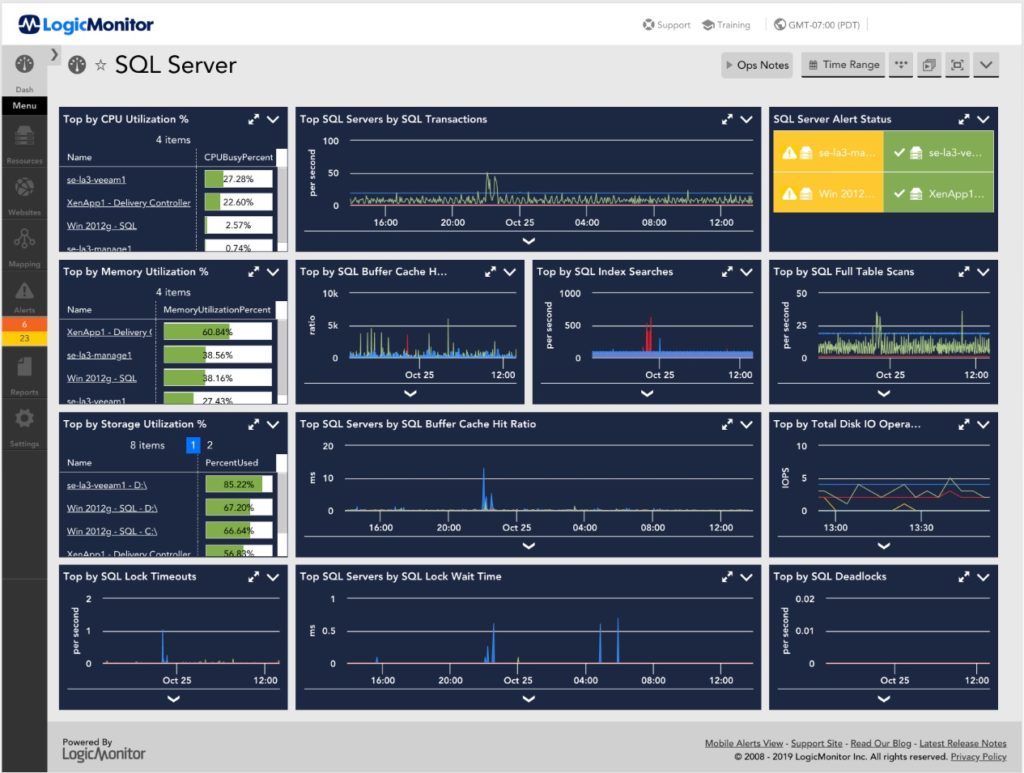
25.1 Pros
- Detailed Metrics: delivers a plethora of metrics related to server performance, indices, and transactions, allowing for thorough database analysis.
- Powerful Alerting System: provides timely alerts for potential issues, preventing unexpected downtimes.
- Forecasting Tools: uses predictive analytics to determine future workloads and spot potential capacity related issues ahead of time.
- Scalability: as a cloud-based platform, it ensures easy scale-up or scale-down as per business needs without hardware constraints.
25.2 Cons
- Complex Setup: setting up the tool for monitoring can be complex and might require technical expertise.
- Steep Learning Curve: due to the widespread functionality, it may be challenging for novice users to fully utilise the tool from the onset.
- Cost Prohibitive: the pricing model may be high, especially for small and medium-sized businesses with limited budgets.
26. Woodler SMT SQL Server Performance Tuning and Monitoring
Woodler’s SMT (SQL Server Performance Tuning and Monitoring) offers a hands-on solution for maintaining the performance of MS SQL Servers. It aims to deliver end-to-end performance management and optimization control for your SQL databases.
Woodler’s SMT uses a combination of monitoring techniques to deliver detailed insights into your SQL Server’s performance. It carries out continuous surveillance of your servers and databases, ensuring they maintain an optimal performance level. The monitor encompasses various features including query optimization, index management, and deadlock detection, allowing DBAs to be proactive about maintaining the health of their databases.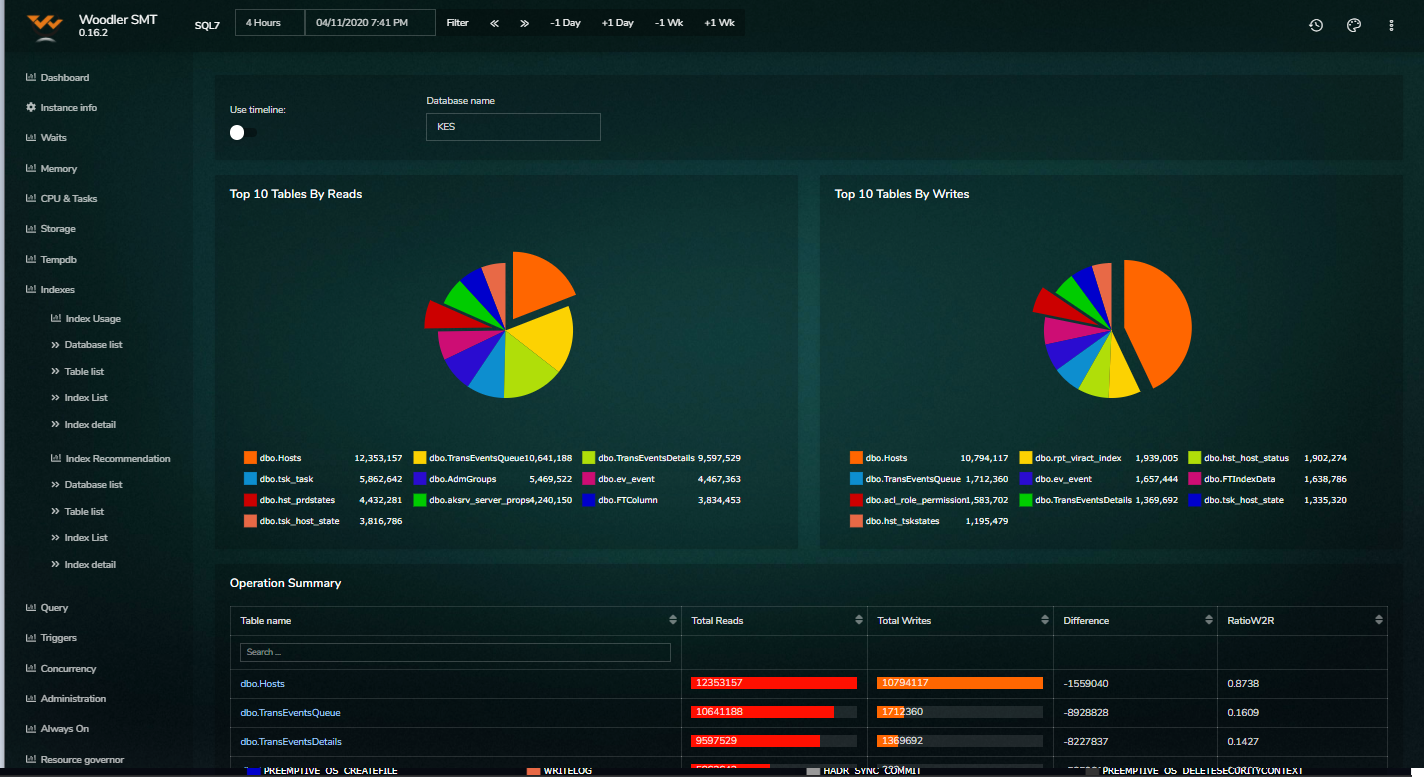
26.1 Pros
- Performance Tuning: delivers comprehensive solutions for optimizing server performance, improving speed and efficiency.
- Query Optimization: offers tools and recommendations for improving SQL queries, enhancing database responsiveness.
- Deadlock Detection: alerts about deadlock conditions, facilitating quick resolution of concurrency issues.
- Index Management: provides tools for proper index creation, modification, and deletion, improving data access speed.
26.2 Cons
- Usability: users might find the interface less intuitive as compared to other platforms, leading to a steeper learning curve.
- Limited Integrations: might not integrate seamlessly with other database types outside of Microsoft SQL Server.
- Cost: can be expensive for small to mid-sized organizations as it may require additional investments in training and learning resources.
27. Spotlight – SQL Server Database Monitoring
Spotlight provides a comprehensive Sql Server Database Monitoring solution that aims to simplify SQL server health checks and issue resolution.
Spotlight’s SQL Server Database Monitoring offers real-time monitoring and diagnostics, with visualization features that provide comprehensive overviews of the health and performance of SQL databases. The software highlights issues and bottlenecks, making it easier to troubleshoot and fix problems promptly. It also offers an advanced workload analysis feature, helping users better understand SQL workloads and optimize them accordingly.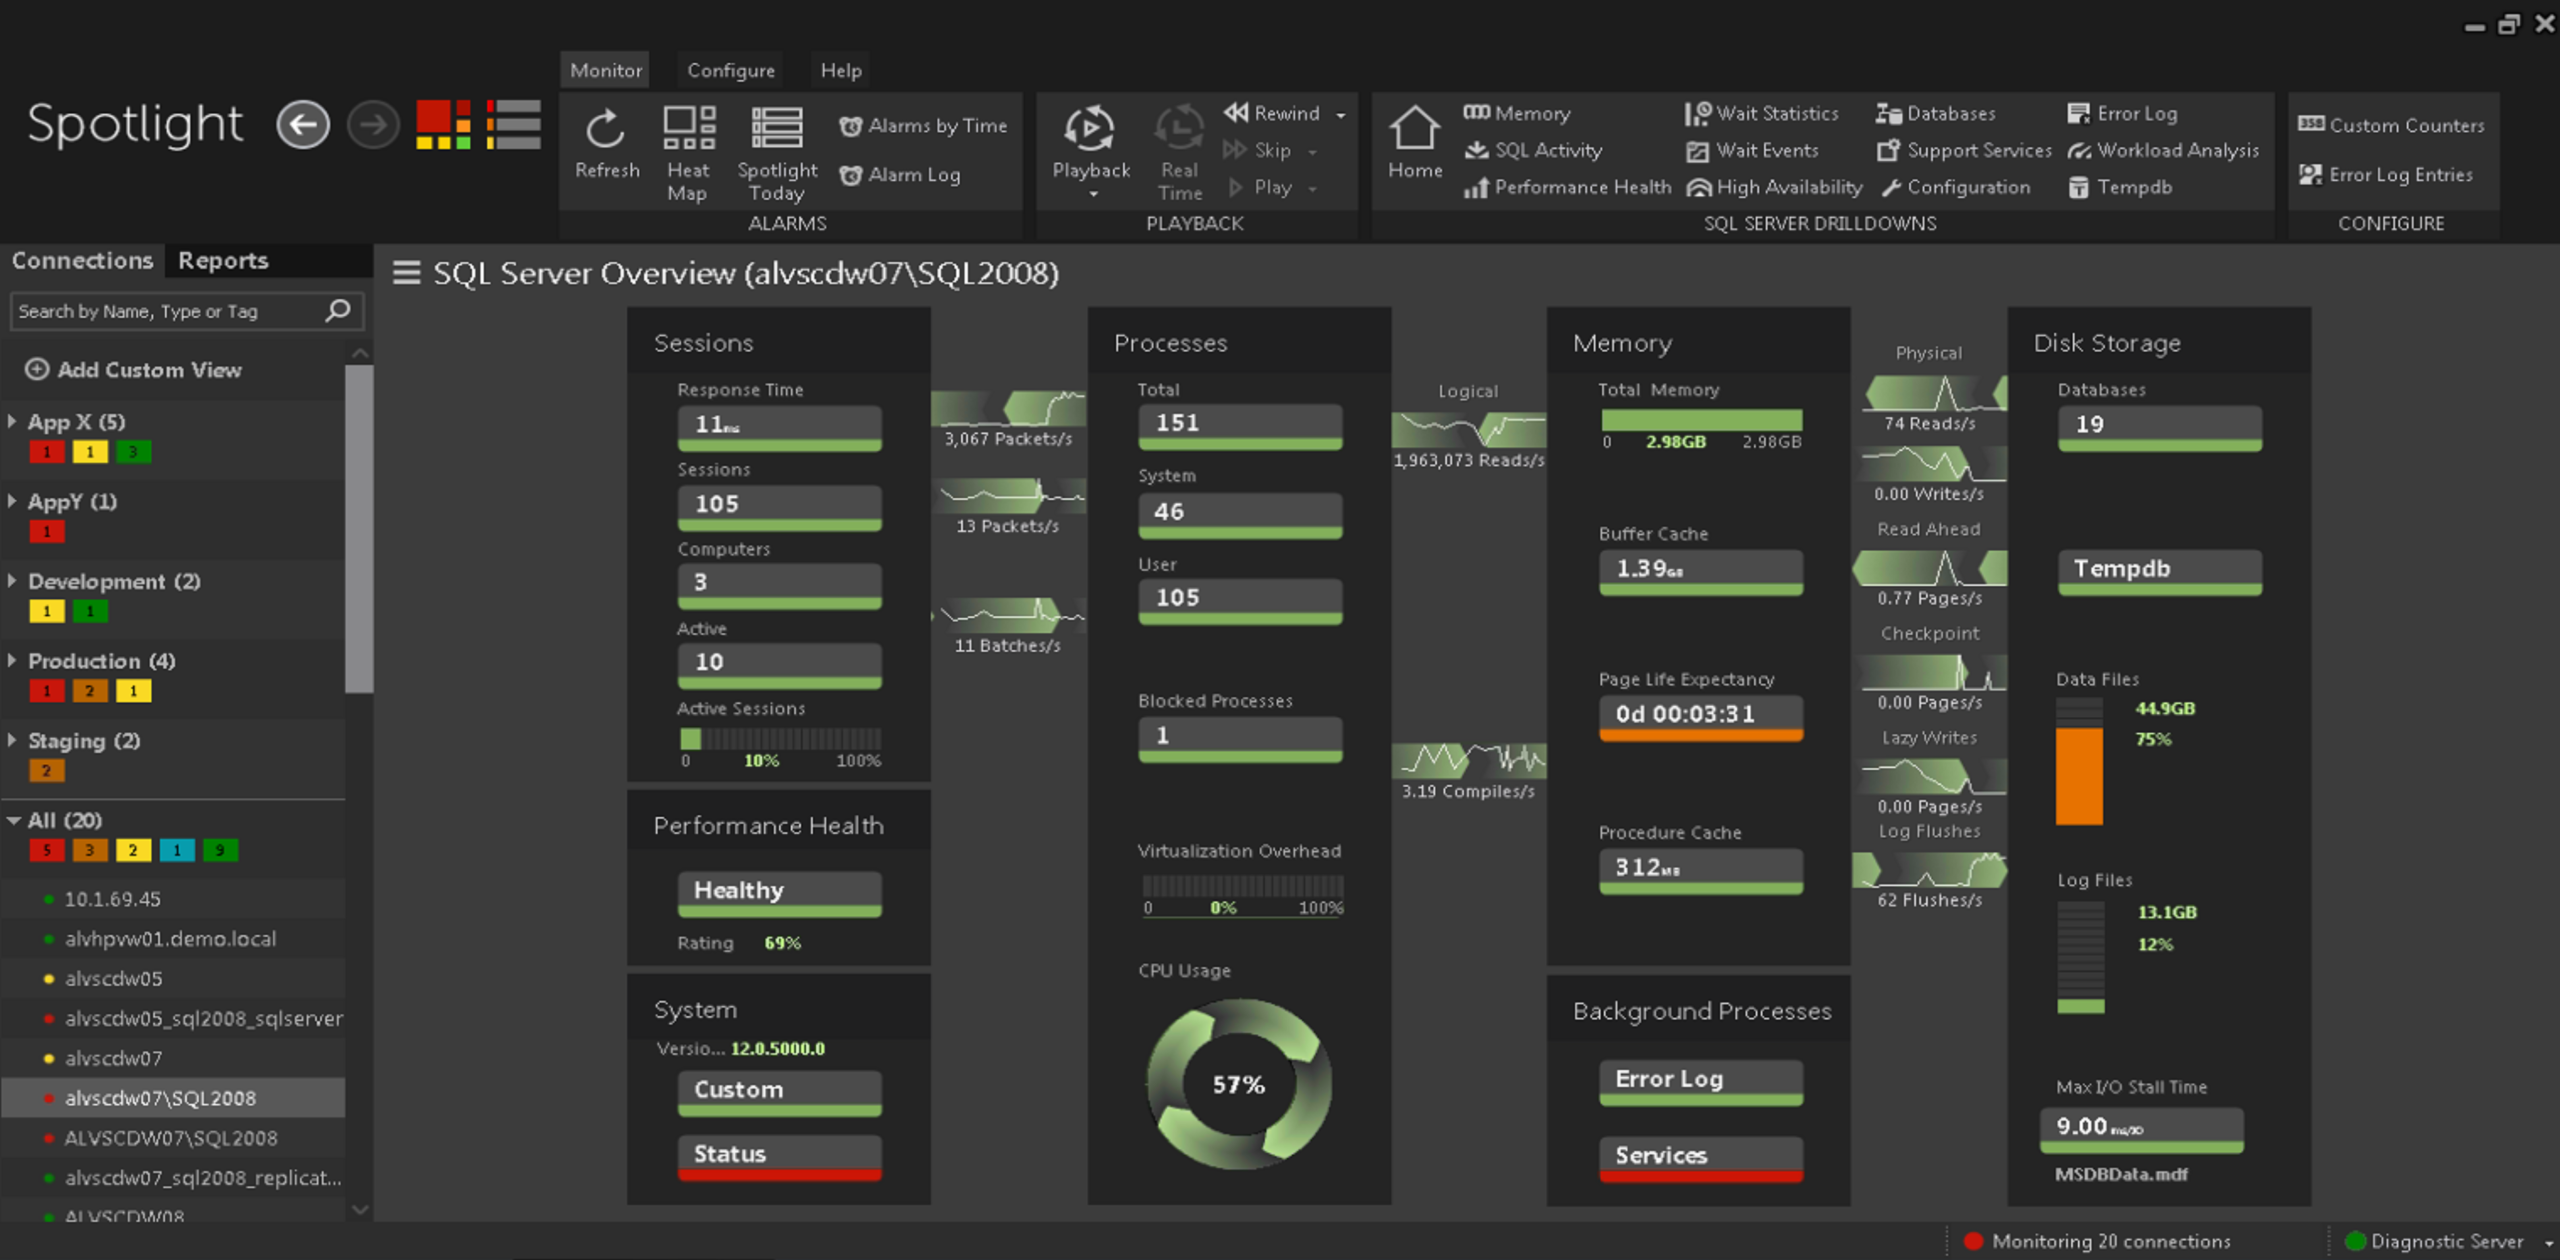
27.1 Pros
- Intuitive Visualization: provides visual representations of SQL server performance, making it easy to understand and interpret data.
- Alerts and Notifications: provides real-time alerts about potential issues, enabling quick action.
- Workload Analysis: offers the ability to analyze and optimize SQL server workload, improving overall performance.
- Integrated Health-check: offers an integrated health-check facility for SQL servers, facilitating fast and thorough server examination.
27.2 Cons
- User Interface: some users may find the user interface lacking in customization options.
- Complex Features: some of the advanced features might be difficult to understand and use effectively, especially for less experienced users.
- Cost: the pricing can be a bit high for smaller organizations or those with limited budgets.
28. BizTalk360 Performance Monitoring
BizTalk360 is a well-known tool for monitoring BizTalk environments, and also provides performance monitoring for MS SQL Server databases interacting with BizTalk Server applications.
BizTalk360 Performance Monitoring tool offers a range of features tailored towards monitoring SQL Server databases in relation to BizTalk environments. It efficiently monitors important performance counters for SQL Server databases and allows users to create custom widgets for monitoring specific components such as CPU usage, buffer caching, and query processing.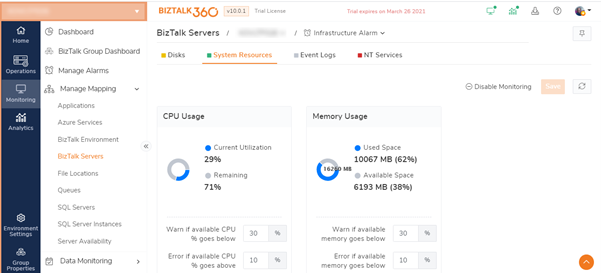
28.1 Pros
- Custom Widget: enables users to create widgets for monitoring specific database performance parameters, enhancing overall control.
- Data Collection: collects and presents historical data to help in trend analysis and future forecasting.
- Error Description: provides detailed error descriptions for troubleshooting, leading to faster issue resolution.
- BizTalk Server Integration: designed especially for BizTalk environments, it ensures seamless integration with BizTalk servers.
28.2 Cons
- Limited to BizTalk Environments: while efficient, its usability is mostly limited to organizations utilizing BizTalk Server environments.
- Learning Curve: the tool comes with many features and configurations which can require a reasonable amount of time to master.
- Pricing: might be considered expensive compared to other monitoring tools, especially for businesses not utilizing BizTalk servers.
29. SysKit Monitor Server Performance Monitoring
SysKit Monitor is a server performance monitoring tool designed to provide detailed, real-time insights into server statuses and activities.
SysKit Monitor gives administrators a unified view of their server performance, allowing them to track CPU usage, memory usage, disk usage and more across multiple servers from a single console. With its proactive alerts and in-depth reports, SysKit Monitor ensures optimal server performance and quick resolution of potential issues.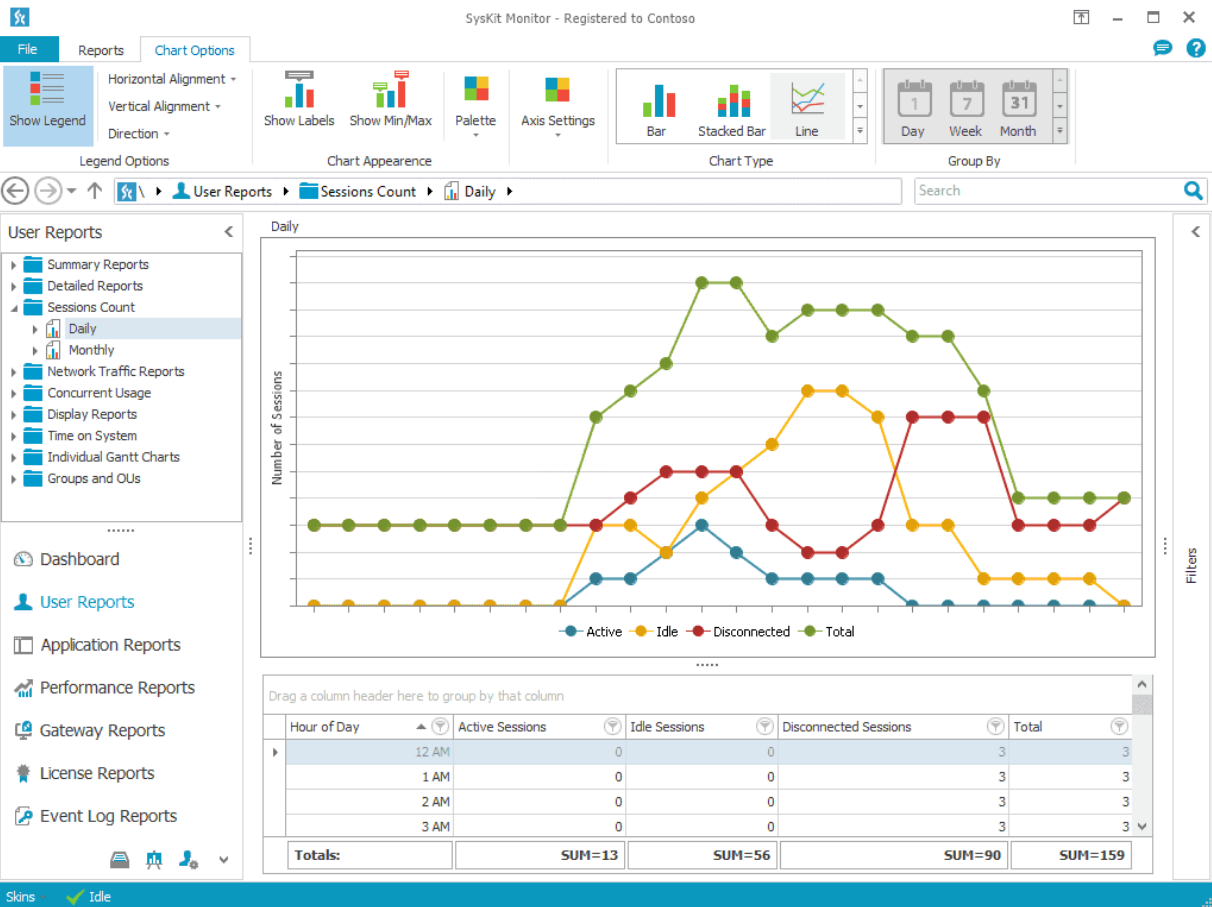
29.1 Pros
- Unified Dashboard: provides a centralized view of all server performance metrics, aiding in easy monitoring.
- Proactive Alerting: enables early detection and notification of potential issues, allowing time to mitigate before they escalate.
- Detailed Reports: offers comprehensive reports with valuable data insights for informed decision making.
- Application Monitoring: in addition to server metrics, it also monitors specific applications for performance fine-tuning.
29.2 Cons
- Setup Difficulty: the initial setup can be complex for inexperienced users.
- Limited Customization: may lack advanced customization options as compared to peer monitoring solutions.
- Technical Support: some users report delays or insufficiently detailed responses from the technical support team.
30. WhatsUp Gold SQL Server Monitoring Tool
WhatsUp Gold is a comprehensive and powerful SQL Server Monitoring tool designed to provide extensive insights into SQL Server performance metrics.
With WhatsUp Gold, you can monitor SQL Server databases and hosted applications, detect and resolve performance issues before they become a challenge. It provides real-time monitoring capabilities and intelligent alerting system along with provisioning of interactive network map and customizable dashboards for easy understanding of data.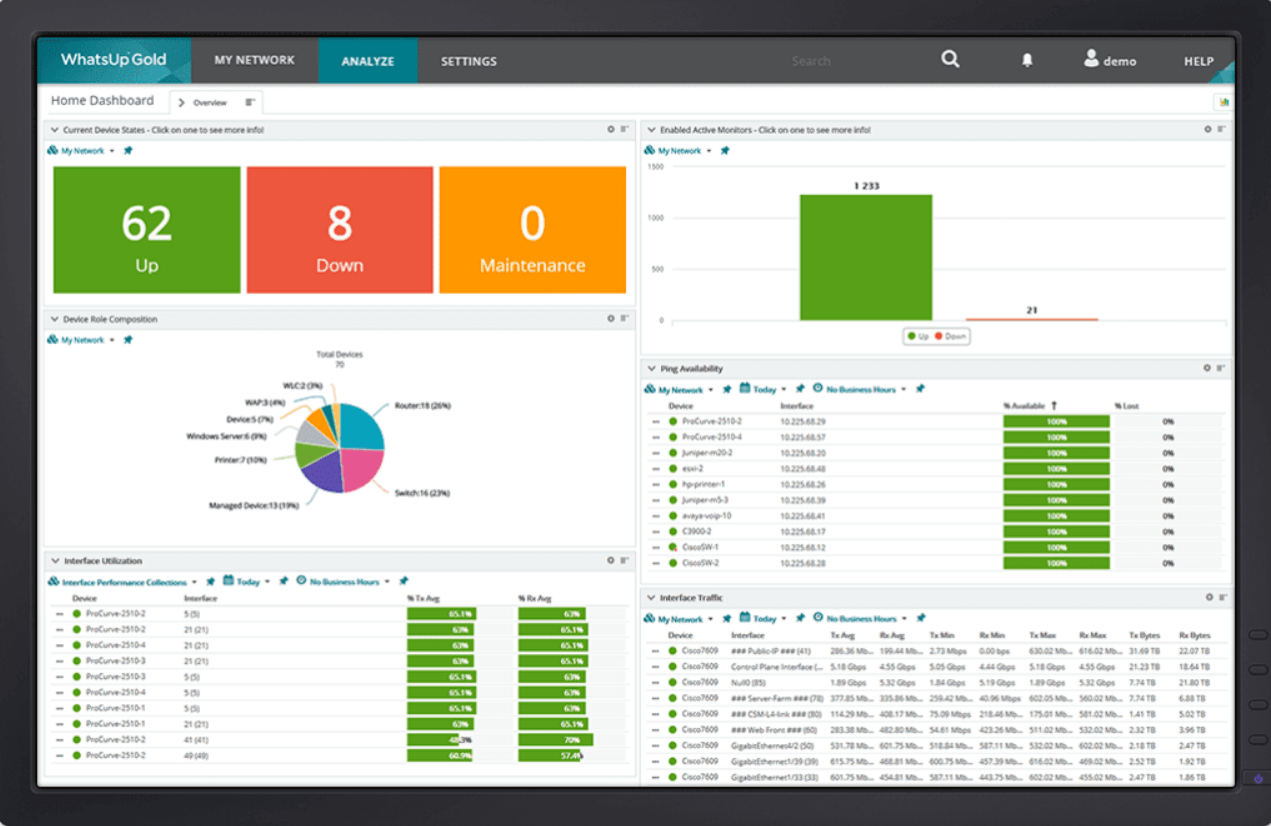
30.1 Pros
- User-friendly: Offers user-friendly design and interactive interface that simplifies the monitoring of SQL Server performance.
- Real-time Monitoring: Provides real-time monitoring of SQL Server metrics ensuring that problematic conditions are detected immediately.
- Customizable alerts: Offers detailed alerts that can be customized based on the severity of specific conditions.
- Comprehensive reporting: Delivers extensive reporting capabilities that support informed decision making.
30.2 Cons
- Integration Challenges: Users may face challenges while integrating it with other existing systems.
- Complexity: The system can be complex to understand and require considerable time investment to fully exploit the system’s capabilities.
- Pricing: Would require considerable budget allocation, making it potentially less accessible for small businesses.
31. AppDynamics Database Monitoring
AppDynamics is a versatile database monitoring tool, designed to provide comprehensive monitoring and performance tuning for MS SQL databases.
AppDynamics offers end-to-end visibility into your MS SQL databases across physical, virtual, and cloud environments. Detailed metric collection, insightful dashboards, and real-time alerts are among the key features that make AppDynamics a preferred choice for SQL Server monitoring. It also provides deep code-level diagnostics enabling early identification and quick resolution of database performance problems.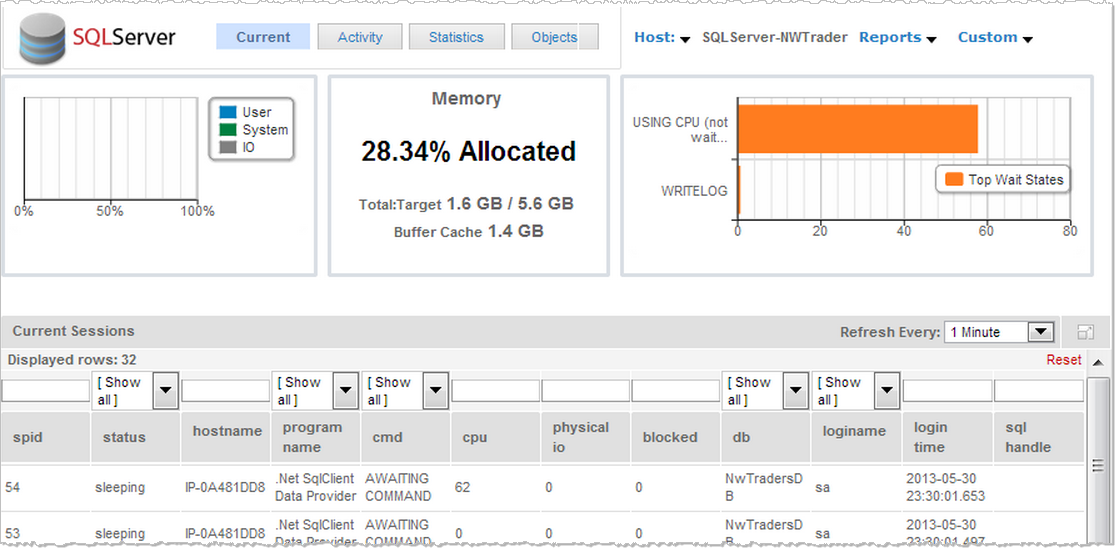
31.1 Pros
- Deep Diagnostics: offers code-level insights, allowing better understanding and resolution of problems.
- Dynamic Baselining: provides automatic baselining of performance metrics to distinguish normal performance from abnormal behavior.
- Real-time Alerting: delivers real-time notifications about issues or abnormal performance.
- Flexible and Scalable: designed to monitor databases across multiple environments including physical, virtual, and cloud.
31.2 Cons
- Complexity: the vast array of features can make it complex and challenging to use for beginners.
- Pricing: the licensing and pricing structure can be high for smaller businesses or startups.
- Steep Learning Curve: might require additional training or resources to fully leverage the tool’s capabilities.
32. Spiceworks – SQL Monitoring Software
Spiceworks provides a capable SQL monitoring tool designed to offer essential monitoring capabilities.
Spiceworks SQL Monitoring Software enables DBAs to stay informed about the health and performance of their SQL servers. With features like performance monitoring, database health checks, and real-time alerts, Spiceworks provides a simplified approach to database monitoring. Plus, it fosters a large community of IT professionals, where users can share issues and find solutions.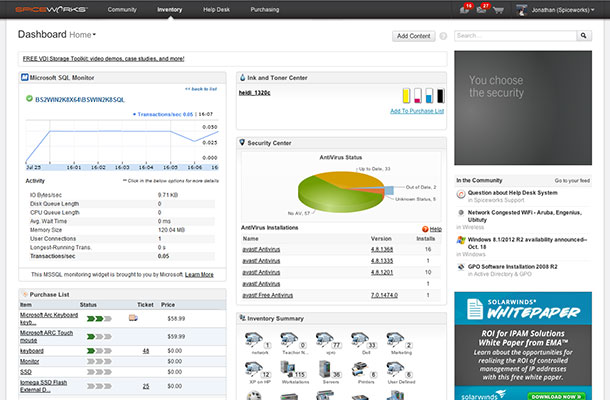
32.1 Pros
- User-friendly: Offers intuitive and easy-to-navigate user interface.
- Community Support: Large community of IT professionals available for issue sharing and solution finding.
- Cost-Effective: As a free software, it is cost-effective and accessible for all kinds of businesses.
- Real-Time Alerts: Provides real-time alerts to notify admins of potential issues.
32.2 Cons
- Limited Features: May lack some of the advanced functionality found in premium SQL monitoring tools.
- Performance: There can be occasional delays or slow response times during peak usage.
- Ads: Being a free tool, it may display ads which can cause distractions.
33. DBArtisan SQL Monitoring Software
DBArtisan is a renowned SQL monitoring tool designed to enhance the performance and availability of databases.
DBArtisan SQL Monitoring software provides DBAs with a powerful set of tools encompassing performance tuning capabilities, database management, and SQL development. It offers a central viewpoint for all major database platforms, making it a versatile choice for managing complex database infrastructures.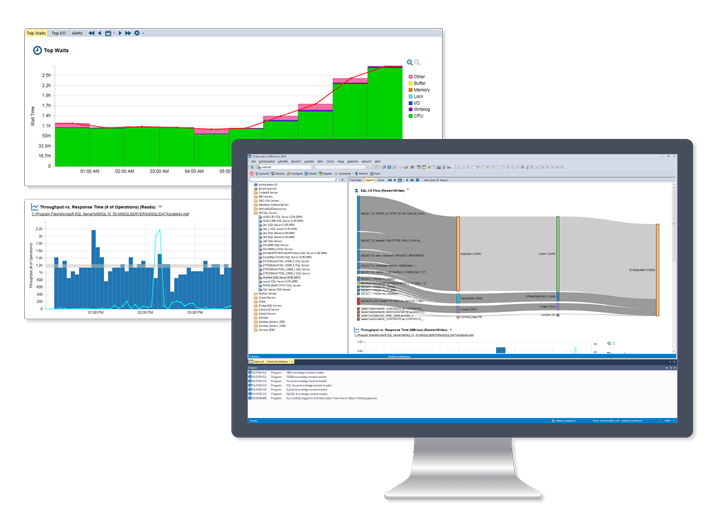
33.1 Pros
- Multi-platform Support: Supports a wide range of database platforms, providing a versatile solution for managing mixed database environments.
- Performance Tuning: Provides robust performance tuning features to optimize SQL performance.
- Comprehensive Management: Offers comprehensive database management and SQL development capabilities for effective database administration.
- Data Analysis: Accommodates data analysis for better understanding of the database environment and performance.
33.2 Cons
- User Interface: Some users may find the interface somewhat outdated and less intuitive.
- Learning Curve: The variety of features and complex functionality contribute to a steep learning curve for beginners.
- Cost: The high-end features of DBArtisan come along with a higher price point, potentially making it less accessible for smaller businesses.
34. Nagios XI SQL Monitoring Software
Nagios XI is a strong contender in the SQL monitoring software market, offering extensive monitoring and management features for Microsoft SQL Server databases.
Nagios XI ensures efficient monitoring of critical databases including MS SQL, MySQL, Oracle and more. It provides in-depth insights into database availability, performance metrics, and disk usage. With an alerting system, it ensures administrators are promptly notified of any issues, allowing swift resolution and minimizing downtime.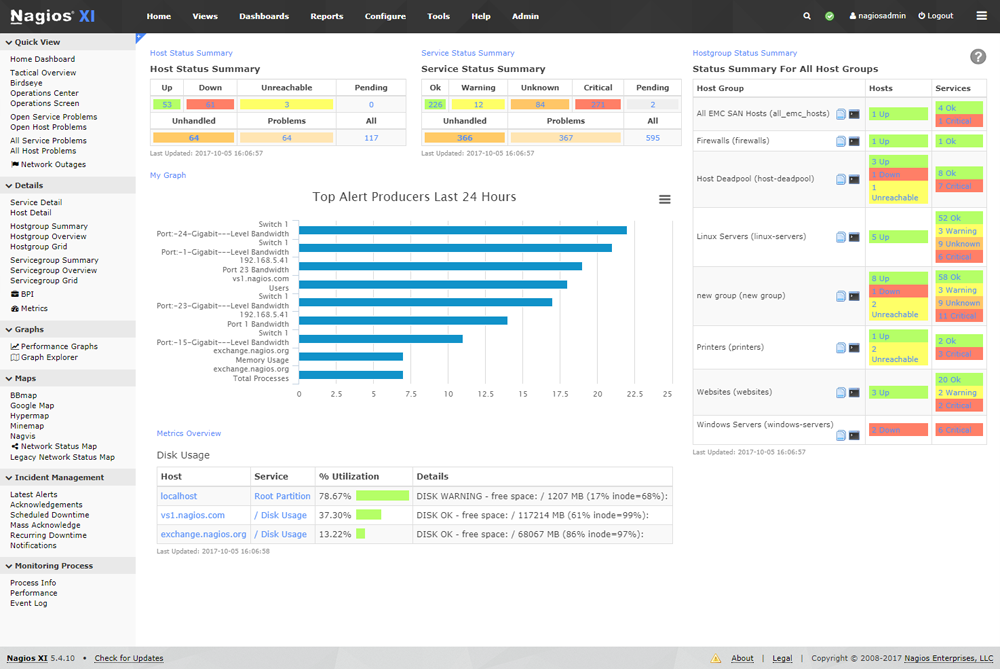
34.1 Pros
- Multi-Database Support: Offers support not just for SQL Server but also Oracle, MySQL and other major database platforms.
- Alerting System: Alerts administrators in real-time of any issues or potential problems.
- Report Generation: Provides comprehensive report generation with detailed insights into the performance of databases.
- Automatic Discovery: Features automatic discovery of databases, simplifying the setup process and shortening the time to effective monitoring.
34.2 Cons
- Learning Curve: With extensive features, it may have a steeper learning curve for first-time users.
- User Interface: Some users consider its user interface a bit outdated and less intuitive.
- Technical Support: Some users report the customer support service may sometimes be slow or inadequate.
35. Heroix Longitude Database Monitoring
Longitude Database Monitoring from Heroix is a comprehensive tool that provides real-time monitoring and performance management for SQL Server databases. Its user-friendly interface, automated features, and predictive alerts make database management easier and more effective.
Heroix Longitude offers an extensive array of features for monitoring the health and performance of your databases. It automatically collects data from your SQL Server databases, providing real-time insights into key metrics like bottlenecks, performance degradation, and health status. The scalable architecture and intuitive dashboards make Longitude a top choice in MS SQL monitors.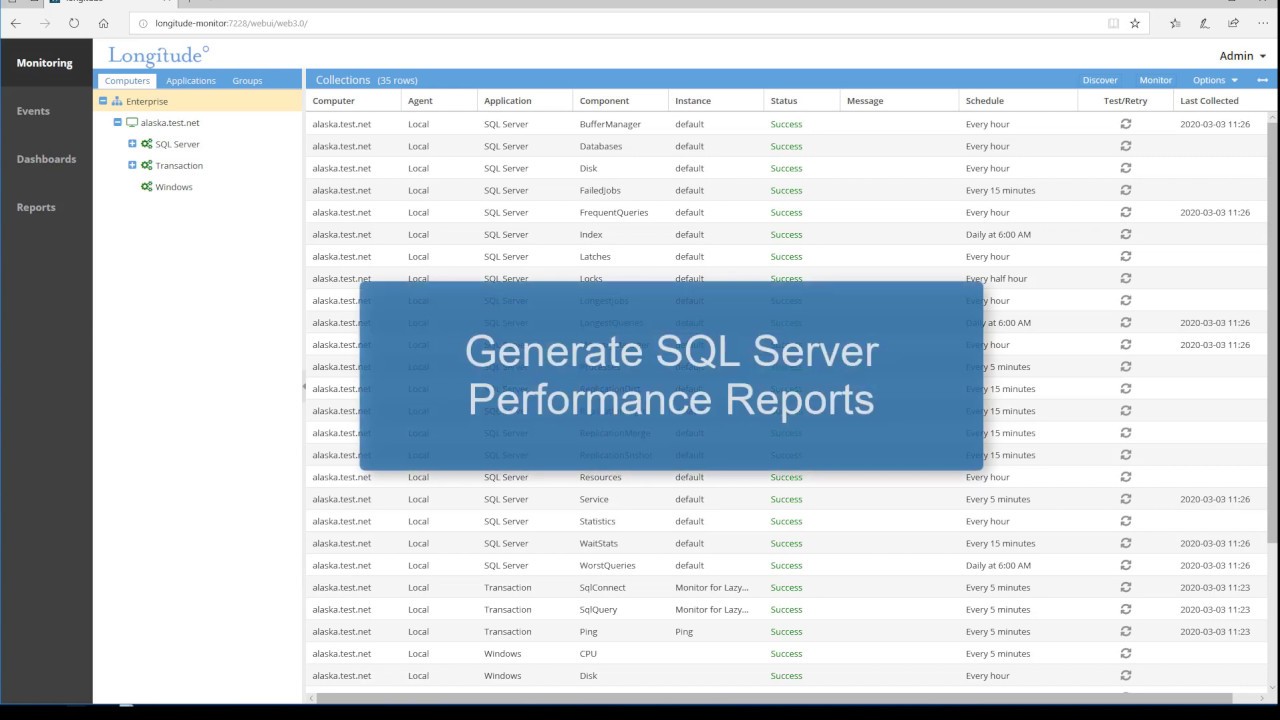
35.2 Pros:
- Real-time alerts: Longitude immediately notifies you of any critical issues detected, enabling you to address problems before they become significant.
- Automated reporting: With the automated reporting feature, you can create custom reports on database performance and behavior, thus saving time and reducing the risk of human errors.
- Out of the box monitoring: Longitude provides extensive out-of-the-box monitoring capabilities, which means minimal configuration and faster deployment times.
- Scalability: Longitude’s scalable architecture makes it suitable for monitoring SQL Server databases of all sizes, from small businesses to large enterprises.
35.3 Cons:
- User interface: Although user-friendly, the interface might necessitate a learning curve for those not familiar with database monitoring tools.
- Advanced configuration: While Longitude’s out-of-the-box monitoring capabilities are extensive, advanced configuration might need some sort of technical expertise.
- Custom scripts: There are limitations in terms of running and managing custom scripts within the tool. For detailed customizations, one might have to rely on SQL Server’s built-in scripting capabilities.
36. SQLCentric MSSQL-Centric Network Database Monitoring
SQLCentric is a network database monitoring tool specifically designed for the MS SQL platform. With a diverse set of monitoring capabilities, it helps administrators manage SQL Server health and performance with greater ease and efficiency.
Hosting an array of intuitive features, SQLCentric aims to simplify SQL Server monitoring and management. Its web-based interface offers a consolidated view of all monitored SQL Server instances, allowing administrators to quickly assess and address any issues, reducing downtime and enhancing productivity. SQLCentric is also known for its substantial reporting capabilities, which include the comprehensive breach and clearance reports.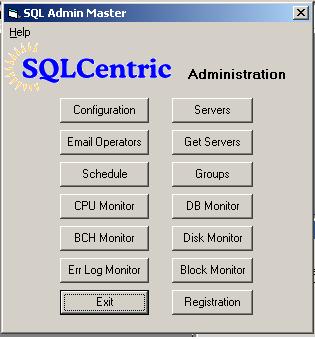
36.2 Pros:
- MS SQL-centric: SQLCentric focuses exclusively on MS SQL, resulting in superior and specialized monitoring capabilities for this platform.
- Consolidated View: SQLCentric’s dashboard provides a consolidated view of all your SQL Server instances, making it easier to track and manage them.
- Real-time Alerts: Real-time email and dimensionally colored UI alerts inform you about breaches and clearances in your SQL Servers, ensuring quick issue resolution.
- Extensive Reporting: The tool offers substantial reporting capabilities, including a history of breaches and clearances for effective auditing and compliance.
36.3 Cons:
- Limited Scope: Being MSSQL-centric, SQLCentric might not be the best choice for mixed-platform environments.
- User Interface: As the UI is predominantly packed with data, novice users might find it overwhelming initially.
- Advanced Features: While SQLCentric offers an ample set of features, it might lack some advanced database performance tuning and diagnostics tools expected by experienced DBAs.
37. ApexSQL Monitor
ApexSQL Monitor is an all-in-one SQL Server monitoring tool known for its performance management and auditing capabilities. Utilized by databases administrators globally, it provides essential insights to optimize the performance of MS SQL Server.
ApexSQL Monitor focuses on monitoring key SQL Server parameters and providing sophisticated performance analytics. It offers real-time and historical performance data, allowing you to detect performance bottlenecks and optimalize your SQL Server setup. Along with its extensive query execution monitoring abilities, ApexSQL promises improved SQL Server performance and a streamlined monitoring experience.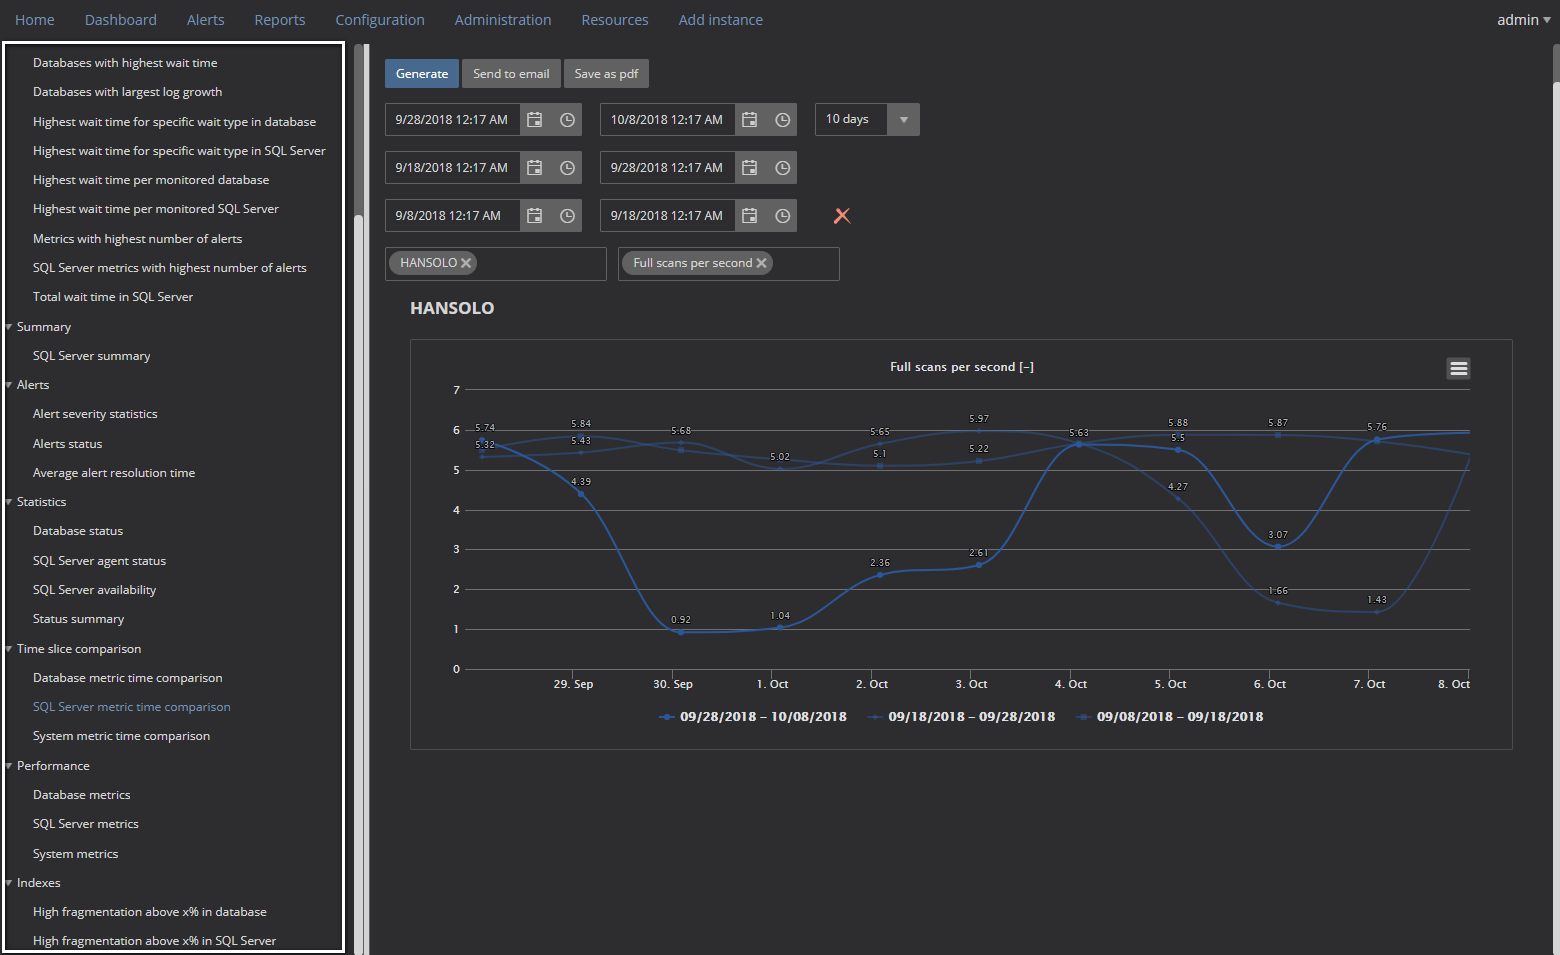
37.2 Pros:
- Data Visualization: ApexSQL Monitor offers excellent data visualization features, making it easier to understand and analyze server performance data.
- Deadlock Monitoring: This feature helps to understand better and resolve the issues related to database deadlocks.
- Query execution monitoring: ApexSQL Monitor can gather data on the longest running queries, frequent queries and queries with high impact which helps to identify SQL Server bottlenecks.
- Email Notifications: Real-time email alerts can be customized to keep you informed about database health and immediately notify about any issues that arise.
37.3 Cons:
- User Interface: While its interface offers a wealth of information, it might be perceived as cluttered and not intuitive for novice users.
- Learning Curve: The tool has a steep learning curve, especially for those unfamiliar with SQL Server monitoring.
- Cost: Relative to other tools on the market, ApexSQL Monitor may be on the more expensive side, especially for smaller businesses.
38. miniDBA: SQL Server Performance Monitoring Tool
miniDBA is designed to enable highly effective SQL Server monitoring by providing a compact but powerful toolset that is easy to use and understand, and practical for businesses of all sizes.
miniDBA is a SQL Server performance monitoring tool that provides both real-time and historical data analysis. It helps users stay aware of their server’s status at all times. With its performance dashboard, detailed database metrics, and customized alert system, miniDBA helps administrators manage performance and troubleshoot issues effectively.
38.2 Pros:
- Ease of Use: miniDBA features a simple, user-friendly interface that makes it easy for beginners to navigate and ensure proper performance monitoring.
- Customized Alerts: The tool provides a customized alert system where you can specify what events trigger an alert, allowing you to respond quickly to problems.
- Performance Dashboard: It provides a consolidated view of key performance metrics, making it easier to detect and resolve potential bottlenecks.
- Historical Data Analysis: miniDBA provides a capacity to track historical data, which aids in identifying trends over time and making proactive decisions.
38.3 Cons:
- Limited Advanced Features: While miniDBA excels in basic monitoring, it might fall short concerning advanced capabilities, especially for large-scale or complex SQL Server environments.
- Scope of Monitoring: The tool mainly focuses on performance metrics. If you require extensive security, compliance, or data auditing features, this might not be the best choice.
- Documentation: Some users might find that the documentation on the tool functionality is not as comprehensive or intuitive as it could be.
39. eG Enterprise Microsoft SQL Monitoring
eG Enterprise is a robust monitoring tool, offering deep insights into Microsoft SQL Server performance. By aiding in the detection and diagnosis of SQL Server performance issues, it helps ensure the smooth operation of your databases.
eG Enterprise Microsoft SQL Monitoring is known for its deep-rooted monitoring capabilities. The tool provides comprehensive insights into every aspect of SQL Server performance, including query execution, processor utilization, and memory usage, among others. Its advanced analytics and reporting capabilities empower IT personnel to efficiently manage their SQL Server instances and ensure optimal performance.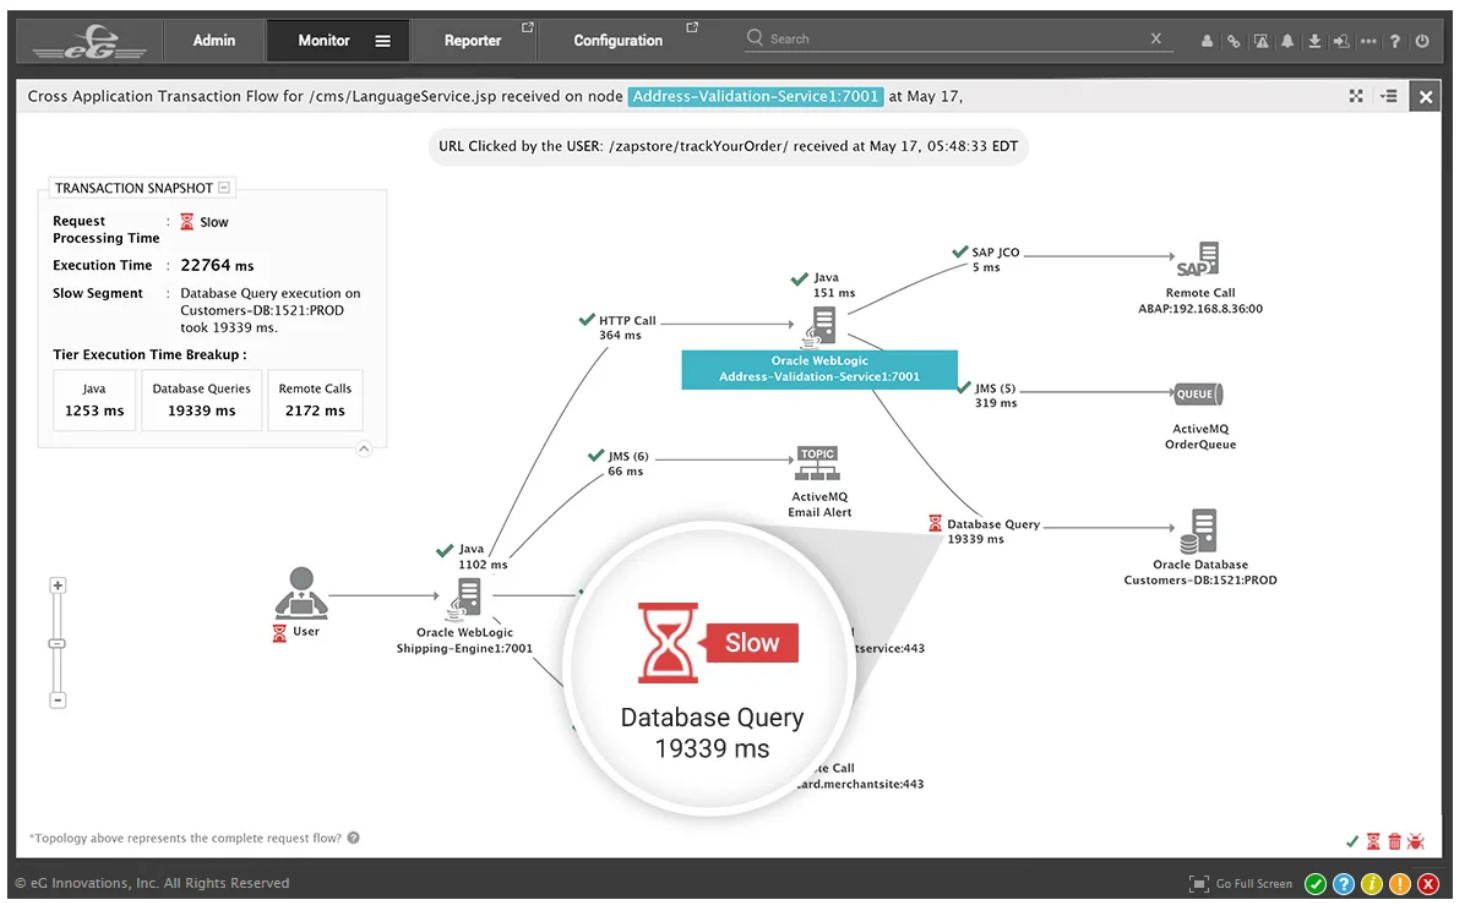
39.2 Pros:
- Depth of Monitoring: eG Enterprise offers an extensive range of SQL Server metrics, providing a comprehensive performance assessment.
- Advanced Analytics: The tool boasts advanced analytics that provide meaningful insight into performance trends and potential issues.
- Automatic Root Cause Diagnosis: It contains a built-in automatic root cause diagnosis feature, expediting the resolution of issues.
- Multi-Platform Support: eG Enterprise supports SQL Server installations on both physical and virtual platforms, giving it an edge in flexibility.
39.3 Cons:
- User Interface: While feature-rich, the user interface might be complex for beginners without prior experience in using database monitoring tools.
- Pricing Model: High-end features come at a cost, and eG Enterprise’s pricing model might appear expensive to small-sized businesses.
- Learning Curve: With its extensive features and capabilities, eG Enterprise has a steeper learning curve compared to some simpler tools on the market.
40. Dynatrace Microsoft SQL Server (MSSQL) Monitoring
Dynatrace offers an innovative and smart approach to database monitoring, catering to modern needs with advanced artificial intelligence capabilities integrated into its system.
Dynatrace MSSQL Monitoring tool provides deep insights into your database operations from an end-to-end perspective. By leveraging artificial intelligence, it automatically detects and diagnoses issues in real-time, helping to resolve problems before they can impact user experience or business operations. With its easy-to-use dashboards and alerts, database management becomes simplified and much more effective.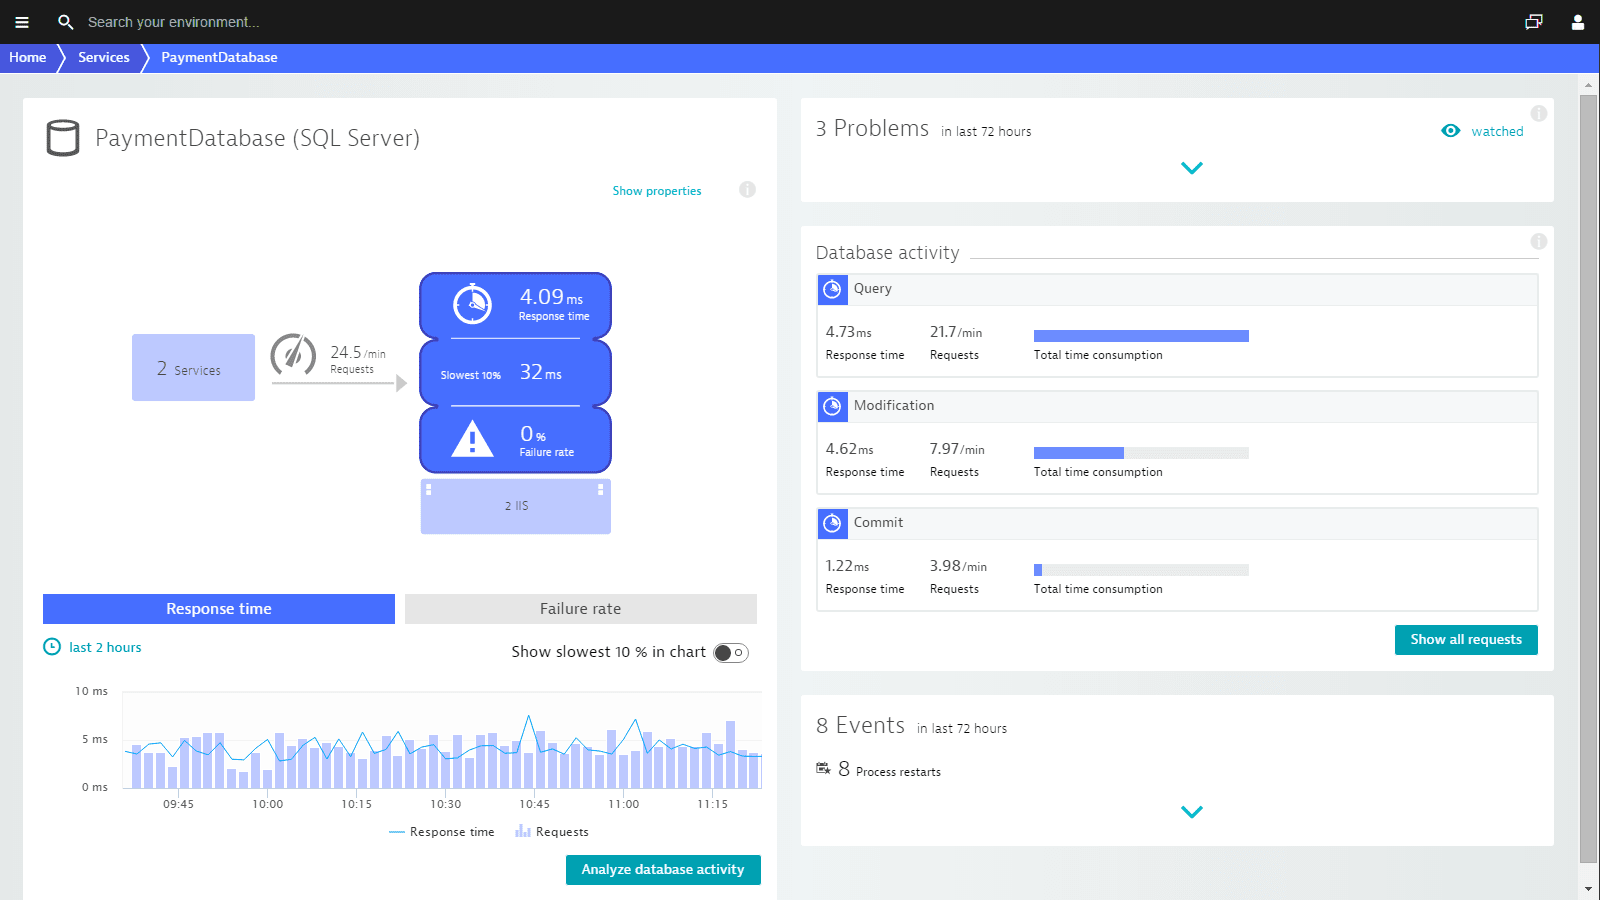
40.2 Pros:
- Artificial Intelligence: Dynatrace applies AI for monitoring and diagnostics, offering smart, automated detection of issues in real-time.
- Comprehensive Monitoring: Dynatrace delivers end-to-end monitoring, giving a complete view of your database performance.
- Performance Metrics: It provides a wide array of important performance metrics, providing you with thorough insights into your database performance.
- User Experience Tracking: Dynatrace tracks and correlates database performance with user experiences, helping to ensure optimal performance.
40.3 Cons:
- Pricing: The advanced features of Dynatrace comes at a relatively high cost, which could make it less accessible for smaller businesses.
- Complexity: While powerful, the wide array of features and data provided by Dynatrace may be overwhelming for first-time or less experienced users.
- Configuration: Configuration of the monitoring setup might require some technical expertise, increasing the initial setup time.
41. SQL Planner Microsoft SQL Server Monitoring
SQL Planner is a unique monitoring tool, offering a planning-oriented approach to SQL Server health and performance monitoring.
SQL Planner specializes in the monitoring, diagnosing, and planning of Microsoft SQL Server resources. It facilitates predictive analysis, enabling database administrators to anticipate potential issues and manage their SQL Server resources more effectively. Its focus on resource planning and predictive monitoring makes it a unique offering in the market.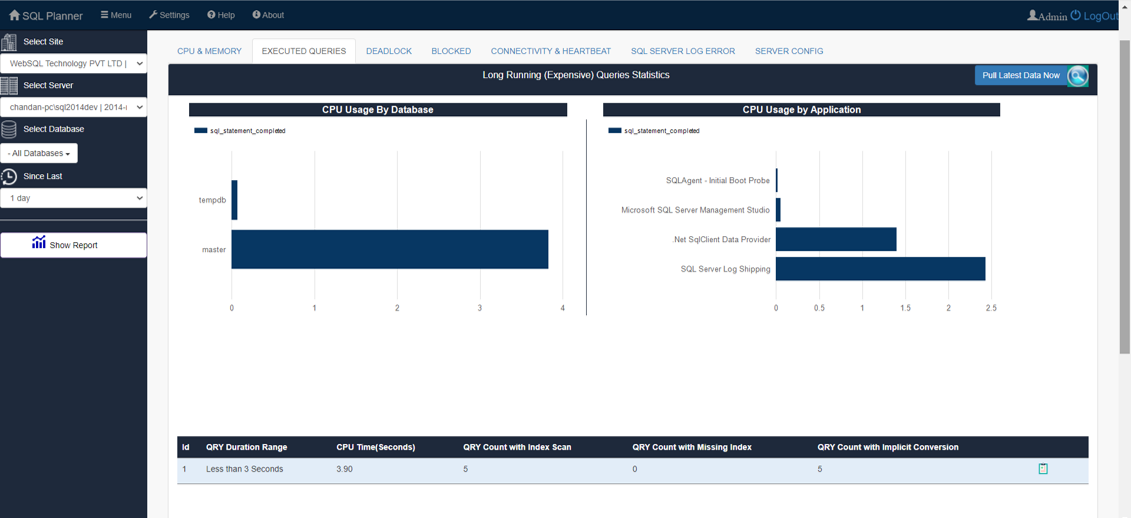
41.2 Pros:
- Resource Planning: SQL Planner’s distinctive resource planning focus helps to prevent issues before they arise.
- Predictive Analysis: The tool’s predictive analysis abilities allow administrators to anticipate potential problems and take proactive action.
- Performance Metrics: SQL Planner provides thorough visibility into performance metrics, aiding DBAs in maintaining SQL Server health.
- Cloud Compatibility: The tool provides capabilities of monitoring SQL Server resources both on-premise and in the cloud environments.
41.3 Cons:
- Narrow Focus: SQL Planner’s focus on resource planning and predictive analysis may limit its capabilities in other areas of monitoring.
- Learning Curve: The unique planning-oriented approach may require a learning process for those used to traditional monitoring tools.
- Interface: The user interface, while functional, may not be as modern or user-friendly compared to newer tools on the market.
42. Navicat Monitor
Navicat Monitor is a flexible and thorough server monitoring tool that supports SQL Server databases. It provides a powerful solution to monitor, analyze and alert administrators to potential issues.
Navicat Monitor gives database administrators the ability to monitor SQL Server instances and conveniently raise alerts to prevent possible SQL Server failures. It provides an intuitive and comprehensive interface that derives useful insights on server performance, availability and health. It caters to the needs of both basic monitoring and complex analytics, thereby making it easy to detect and solve SQL Server issues.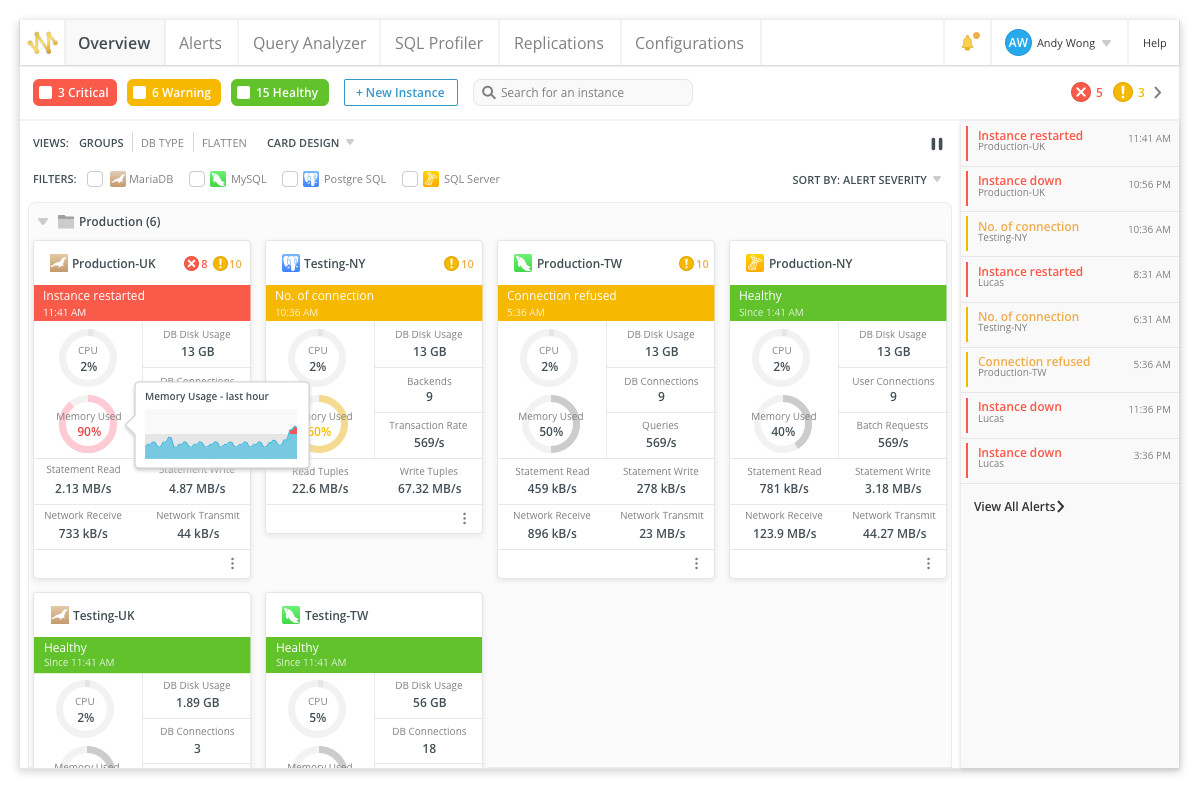
42.2 Pros:
- Real-time Monitoring: Navicat Monitor provides a real-time picture of the server’s operational status, swiftly detecting potential issues.
- Alerts: Users get notified via emails, SNMP traps, or Navicat Cloud when servers become unavailable or when something unusual is detected.
- Visual Dashboard: The dashboard visually presents performance metrics that are essential to keeping SQL Server running smoothly.
- Cross-Platform: It can monitor SQL Server installations in both Windows and Linux environments, offering an advantage in mixed-platform infrastructure.
42.3 Cons:
- Setup Complexity: Initial setup and configuration of Navicat Monitor might require a certain degree of technical knowledge.
- Pricing: Being one of the premium tools, Navicat Monitor might not be affordable for small companies or startups.
- Customization: There could be limitations for users looking to heavily customize their monitoring setup or alerts.
43. VMware SQL Server Performance Monitoring
VMware SQL Server Performance Monitoring tool is an essential resource for database administrators running SQL Server on VMware virtual environments. It complements SQL Server’s innate monitoring capabilities with a focus on virtualization-specific aspects.
VMware’s SQL Server Performance Monitoring is a reliable tool for maintaining peak performance in a virtualized SQL Server environment. It delivers key insights into the performance of SQL Server instances running on VMware, offering metrics from both the server and VMware perspectives. This dual approach helps administrators optimize resource allocation and ensure smooth operation in a virtual environment.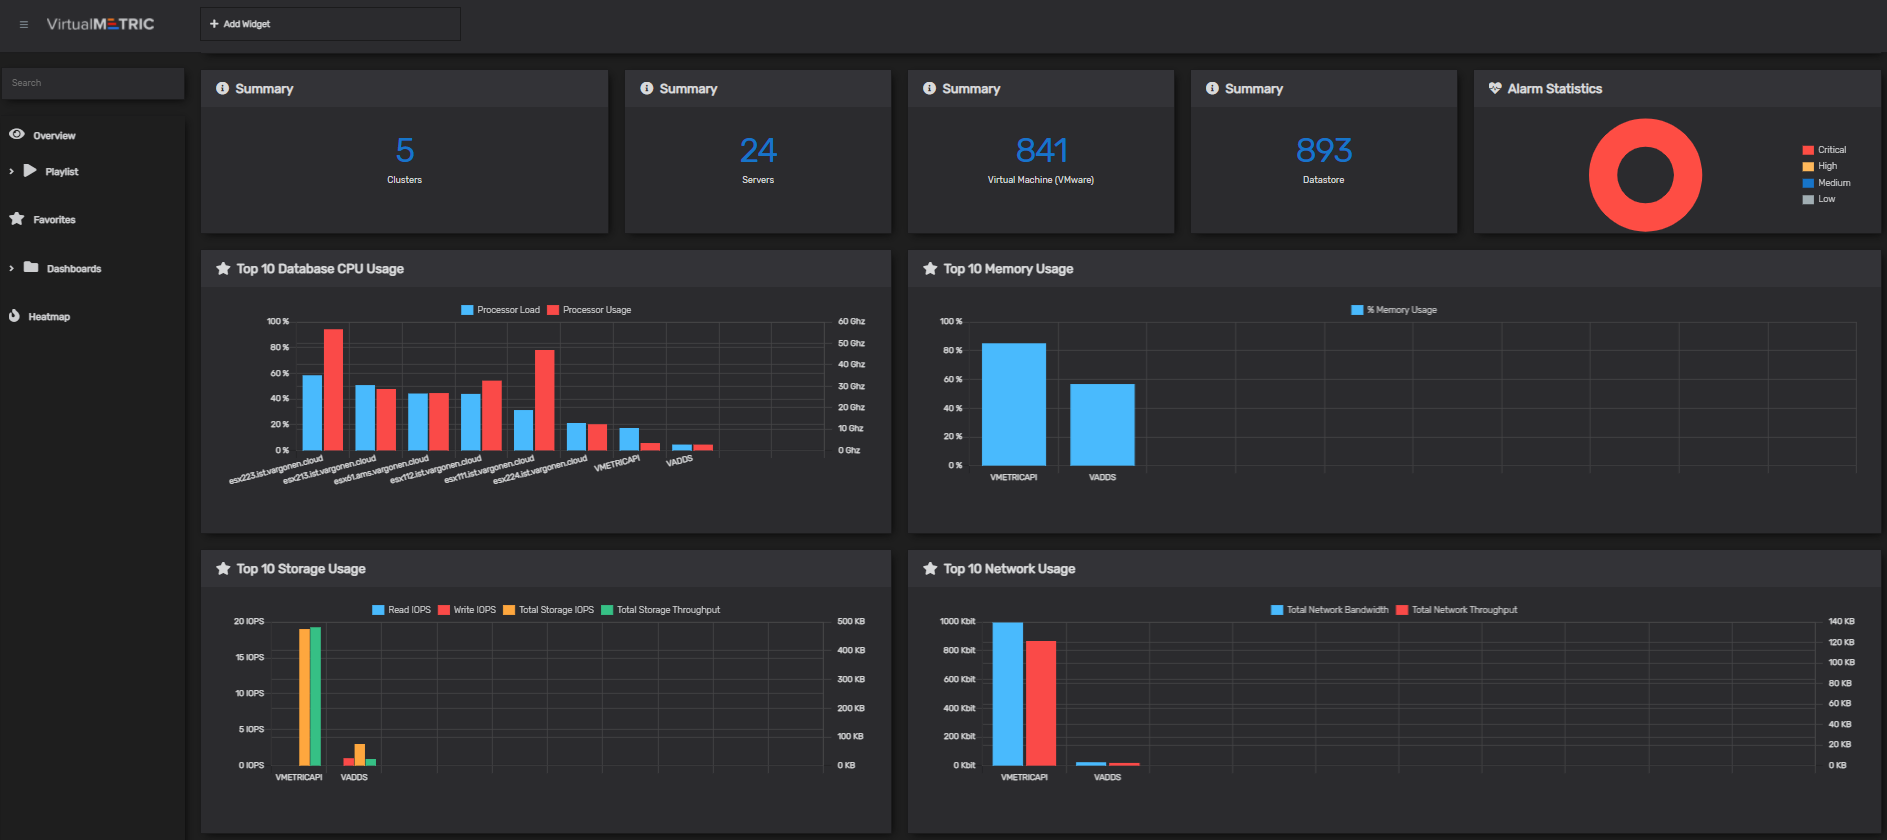
43.2 Pros:
- Specialized Monitoring: The tool delivers specialized monitoring capabilities for SQL Server running on VMware, a distinct advantage for those using this specific setup.
- Comprehensive Data: It combines SQL Server metrics with VMware-specific parameters to offer a comprehensive view of the system’s performance.
- Capacity Planning: The tool helps in analyzing capacity trends over time and assists in effective provisioning of resources.
- Alerts: Proactive alerts help administrators to address potential issues early, preventing bigger problems and downtime.
43.3 Cons:
- Niche Tool: This monitoring tool might not fit the needs of organizations running non-virtualized SQL Server, or SQL Server instances on other virtualization platforms.
- Learning Curve: Considering the uniqueness of its features, there might be a learning curve for administrators not familiar with VMware.
- Integrated Reports: While the tool collects a wealth of information, the ability to create custom, integrated reports could be enhanced.
44. Summary
Having looked at a broad range of MS SQL monitoring tools, here is a summary table to provide a succinct comparison and a brief recommendation based on various user needs.
44.1 Overall Comparison Table
| Tool | Features | Ease of Use | Price | Customer Support |
|---|---|---|---|---|
| Applications Manager’s SQL Monitoring | Real-time monitoring, anomaly detection, SQL Server Reporting, Multi-level thresholds | Medium | High | Good |
| Devart SQL Server Performance Monitoring Tool | Comprehensive monitoring, alerts, data storage, Integrated SQL development | Medium | Medium | Good |
| Database Engine Tuning Advisor | Analytical capabilities, ease of use, automatic tuning, workload analysis | Easy | – | Microsoft Support |
| Database Experimentation Assistant (DEA) | Upgrade assistance, performance insights, workload capturing, data-driven | Medium | – | Microsoft Support |
| Extended Events | Performance impact, flexibility, coding customization, range of events | Hard | – | Microsoft Support |
| Live Query Statistics (LQS) | Real-time insight, execution plan, easy integration, improving query performance | Easy | – | Microsoft Support |
| Open Activity Monitor SQL Server Management Studio (SSMS) | Real-time monitoring, easy access, functional simplicity, server overview | Easy | – | Microsoft Support |
| Query Tuning Assistant | Upgrade support, automated Recommendations, monitoring, easy Integration | Medium | – | Microsoft Support |
| SolarWinds SQL Server Monitoring Tool | Granular detail, real-time monitoring, visual aid, alerting system | Medium | High | Excellent |
| Redgate SQL Server Monitor | User-friendly Interface, proactive alerting, performance diagnostics, server overview | Easy | High | Good |
| SQL Power Tools | Comprehensive monitoring, flexible alerting system, extensive diagnostic tools, security features | Hard | High | Good |
| IDERA’s SQL Server Performance Monitoring Tool | Real-time monitoring, alerts, and capacity planning | Medium | High | Average |
| SolarWinds SQL Sentry | Comprehensive monitoring and diagnostic tools | Medium | High | Average |
| Netwrix Auditor for SQL Server | Security focus, change auditing, reporting | High | High | Good |
| Paessler SQL monitoring software PRTG | IT infrastructure monitoring, customizable alerting | Good | Varies | Good |
| Site24x7 SQL Server Monitoring | Cloud-based, threshold based alerts, reporting | Good | Average | Average |
| Acronis Cyber Protect Cloud | Data protection, cybersecurity, management features | High | Varies | Average |
| Datadog SQL Server Monitoring | Real-time insights, integration with third-party tools | High | Varies | Good |
| CheckMK MySQL Performance Monitoring | Monitor multiple server types, customizable | High | Average | Average |
| dbWatch SQL Server Monitoring and Management | Health checks, scalability, extensive SQL monitoring | Average | Average | Average |
| AimBetter SQL Server Monitoring | Real-time monitoring, alerting, easy configuration | Good | High | Average |
| Lepide SQL Server Auditing | Auditing focus, permission analysis, efficient reporting | Average | High | Slow |
| virtualMETRIC Microsoft SQL Database Monitoring | Real-time monitoring, predictive analytics, reporting. | Medium | High | Average |
| LogicMonitor Microsoft SQL Server Monitoring | Detailed metrics, powerful alerting system, forecasting tools. | Medium | High | Good |
| Woodler SMT SQL Server Performance Tuning and Monitoring | Performance tuning, query optimization, deadlock detection. | Medium | High | Good |
| Spotlight – SQL Server Database Monitoring | Intuitive visualization, alerts and notifications, workload analysis. | High | Medium | Good |
| BizTalk360 Performance Monitoring | Custom widget, data collection, error description. | Medium | Medium | Good |
| SysKit Monitor Server Performance Monitoring | Unified dashboard, proactive alerting, detailed reports. | Medium | Medium | Average |
| WhatsUp Gold SQL Server Monitoring Tool | User-friendly, real-time monitoring, customizable alerts. | High | High | Good |
| AppDynamics Database Monitoring | Deep diagnostics, dynamic baselining, real-time alerting. | Medium | High | Good |
| Spiceworks – SQL Monitoring Software | User-friendly, community support, real-time alerts. | High | Low | Good |
| DBArtisan SQL Monitoring Software | Multi-platform support, performance tuning, comprehensive management. | Medium | High | Good |
| Nagios XI SQL Monitoring Software | Multi-database support, alerting system, report generation. | Medium | Medium | Average |
| Heroix Longitude Database Monitoring | Real-time alerts, automated reporting, and scalability | Good, but might need a learning curve | Mid-range | Available during business hours |
| SQLCentric MSSQL-Centric Network Database Monitoring | Consolidated view, real-time alerts, and extensive reporting | Easy for experienced users. Novice users might find it overwhelming | Mid-range | Available online |
| ApexSQL Monitor | Data visualization, deadlock monitoring, and query execution monitoring | Good for those with monitoring experience, but steep learning curve for beginners | High-End | Online technical support and knowledge base |
| miniDBA: SQL Server Performance Monitoring Tool | Easy-to-use interface, customized alerts, performance dashboard, and historical data analysis | Easy | Mid-Range | Email and online support |
| eG Enterprise Microsoft SQL Monitoring | Deep monitoring capabilities, advanced analytics, and automatic root cause diagnosis | Complex for beginners, easy for experienced users | High-end | Technical support available |
| Dynatrace Microsoft SQL Server (MSSQL) Monitoring | AI application, real-time data, performance metrics, and user experience tracking | Complex for beginners, easy for experienced users | High-end | 24/7 customer support |
| SQL Planner Microsoft SQL Server Monitoring | Resource planning, predictive analysis, and cloud compatibility | Easy for those familiar with planning-oriented monitoring | Mid-range | Online technical support |
| Navicat Monitor | Real-time monitoring, alerts, visual dashboard, and cross-platform compatibility | Good for experienced users | High-end | Email and online technical support |
| VMware SQL Server Performance Monitoring | Specialized monitoring, comprehensive data, capacity planning, and alerts | Easy for those familiar with VMware | High-end | 24/7 customer support |
44.2 Recommended Tool Based on Various Needs
While all tools provide important functionalities, the best choice depends on the specific needs of the user. Beginners might find Database Engine Tuning Advisor or Live Query Statistics (LQS) more user-friendly. For those with high demands and complexity, SQL Power Tools or SolarWinds SQL Server Monitoring Tool may be the perfect fit. If budget is a constraint, the Query Tuning Assistant or Open Activity Monitor in SSMS, both being part of Microsoft’s own suite, could be appropriate choices.
No matter the choice, all these tools have a common goal – to optimize the SQL server’s performance and facilitate smooth and efficient database operations.
45. Conclusion
Selecting the right SQL Monitoring tool is critical to maintaining optimal database performance, spotting bottlenecks, and addressing issues proactively. Each tool carries its own unique strengths and may be tailored to meet the specific needs of different situations.
When selecting the right MS SQL Monitor, it’s essential to consider your specific requirements, such as real-time monitoring, automated alerts, level of detail in reporting, and scope of diagnostics. Additionally, usability, level of support offered, and pricing model are other decisive factors. It’s also crucial not to overlook compatibility with your system and the learning curve associated with each tool.
We hope this comparison guide aids you in making an informed decision when choosing an MS SQL Monitor, which ultimately helps keep your SQL Server performing at its highest level.
Author Introduction:
Vera Chen is a data recovery expert in DataNumen, which provides a wide range of products, including repair BKF product.