1. Introduction
Creating visual graphical representation of data is essential in today’s data-driven world. The ability to clearly present complex data sets can significantly enhance the communication and understanding of information. An Excel graph creator can greatly simplify the creation of these visual repsentations, offering a wide array of chart types, data manipulation tools, and customizable features to perfectly fit your specific needs.
1.1 Importance of Excel Graph Creator
Excel Graph Creators are flung into this era of data visualization and make it easier to understand and interpret data. They are vital tools that turn abstract numbers into comprehendible visuals, making data more digestible for everyone, irrespective of their level of data literacy. They add clarity to reports, presentations and analysis, making communication more effective.
1.2 Objectives of this Comparison
The following comparison is aimed at providing a clear and thorough review of the various Excel graph creators available today. By highlighting their pros and cons, this analysis will assist users in finding the right tool that fits their unique needs and requirements. Additionally, the comparison will serve as a valuable resource for those seeking to understand the functionality and usability of these tools in detail.
1.3 Fix Excel Files
You also need a professional tool to fix Excel files in case they are corrupt. DataNumen Excel Repair is a popular one:
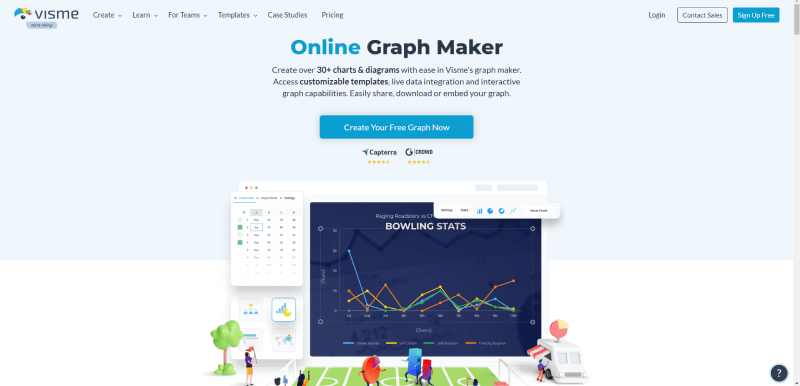
2. Visme Online Graph Maker
Visme is a cloud-based visual content creation and collaboration platform, empowering anyone to create professional, branded content no matter their design background. With its online graph maker, you can easily create stunning charts and graphics by simply uploading your data. Offering a diverse range of pre-made templates and customizable features, Visme aims to make data visualization efficient and effective.
2.1 Pros
- Easy to use: Visme is known for its user-friendly interface, which makes graph creation a hassle-free process.
- Highly customizable: It offers a great deal of customization options for creating differentiated visuals, allowing users to adjust colors, fonts, and images as per their requirements.
- Integration capabilities: Visme can seamlessly integrate with numerous other applications and platforms, facilitating data upload and visualization.
- Cross-platform access: Being a cloud-based tool, Visme allows you to create, edit, and access your graphs from any device with internet access.
2.2 Cons
- Limitations of the free version: While a free version of Visme is available, it comes with limited features. Full access to premium features requires a paid upgrade.
- Learning curve: Despite an easy-to-use interface, initial usage might require some time to get used to its plethora of features.
- Internet dependent: As Visme is an online tool, uninterrupted internet connectivity is required to work without disruptions.
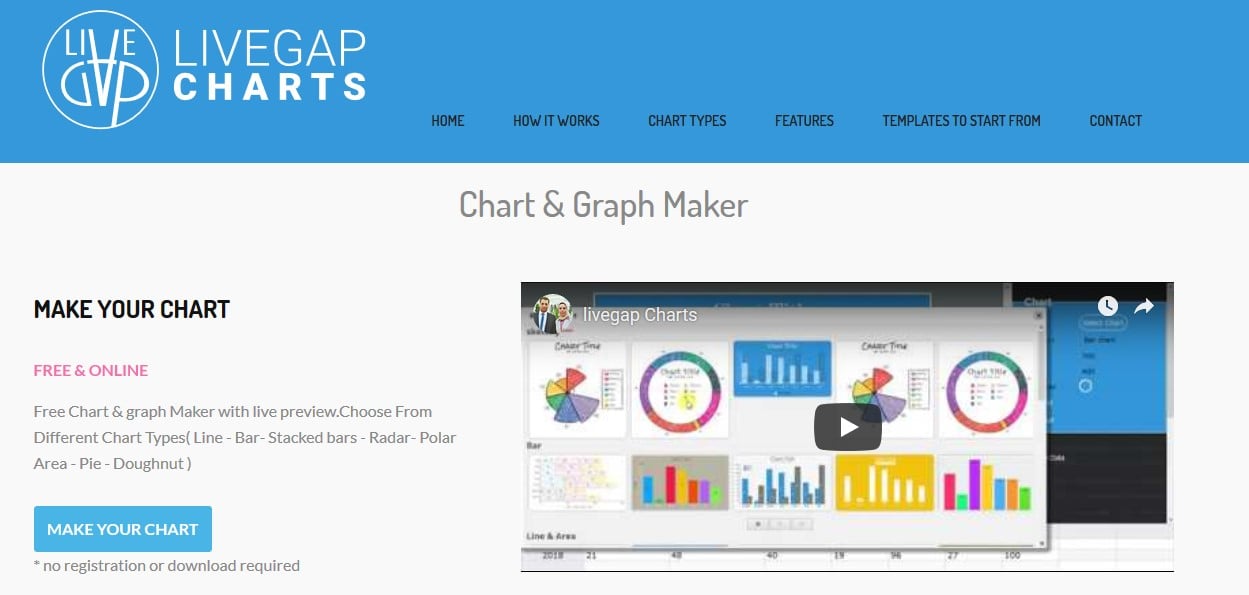
3. LiveGap Charts Excel Graph Creator
LiveGap Charts is a free online chart maker that allows you to create all types of graphs such as bar charts, line plots, histograms, radial bar charts, and more from Excel data. No setup is required, and intuitive functionality makes this tool easy to navigate for those with little or no prior experience in data visualization.
3.1 Pros
- Free of charge: Unlike many other visualization tools, LiveGap Charts offers its complete range of features at no cost.
- No registration required: LiveGap Charts allows instant use without the necessity for a registered account.
- Compatibility: LiveGap can process data input directly from Excel spreadsheets, making it highly compatible for users primarily working with Excel.
- Diverse range of chart types: The platform enables creation of a wide variety of charts, this flexibility allows users to choose the most suitable visual representation for their dataset.
3.2 Cons
- Limited customization: Compared to other tools, customization offerings are relatively limited. The aesthetic changes you can make to your graphs might not fully meet all users’ needs.
- Lacks advanced features: More intricate graphing features that are typical of some paid services might not be present in LiveGap.
- No user support or guides: LiveGap falls short when it comes to user assistance or step-by-step guides for their tools.
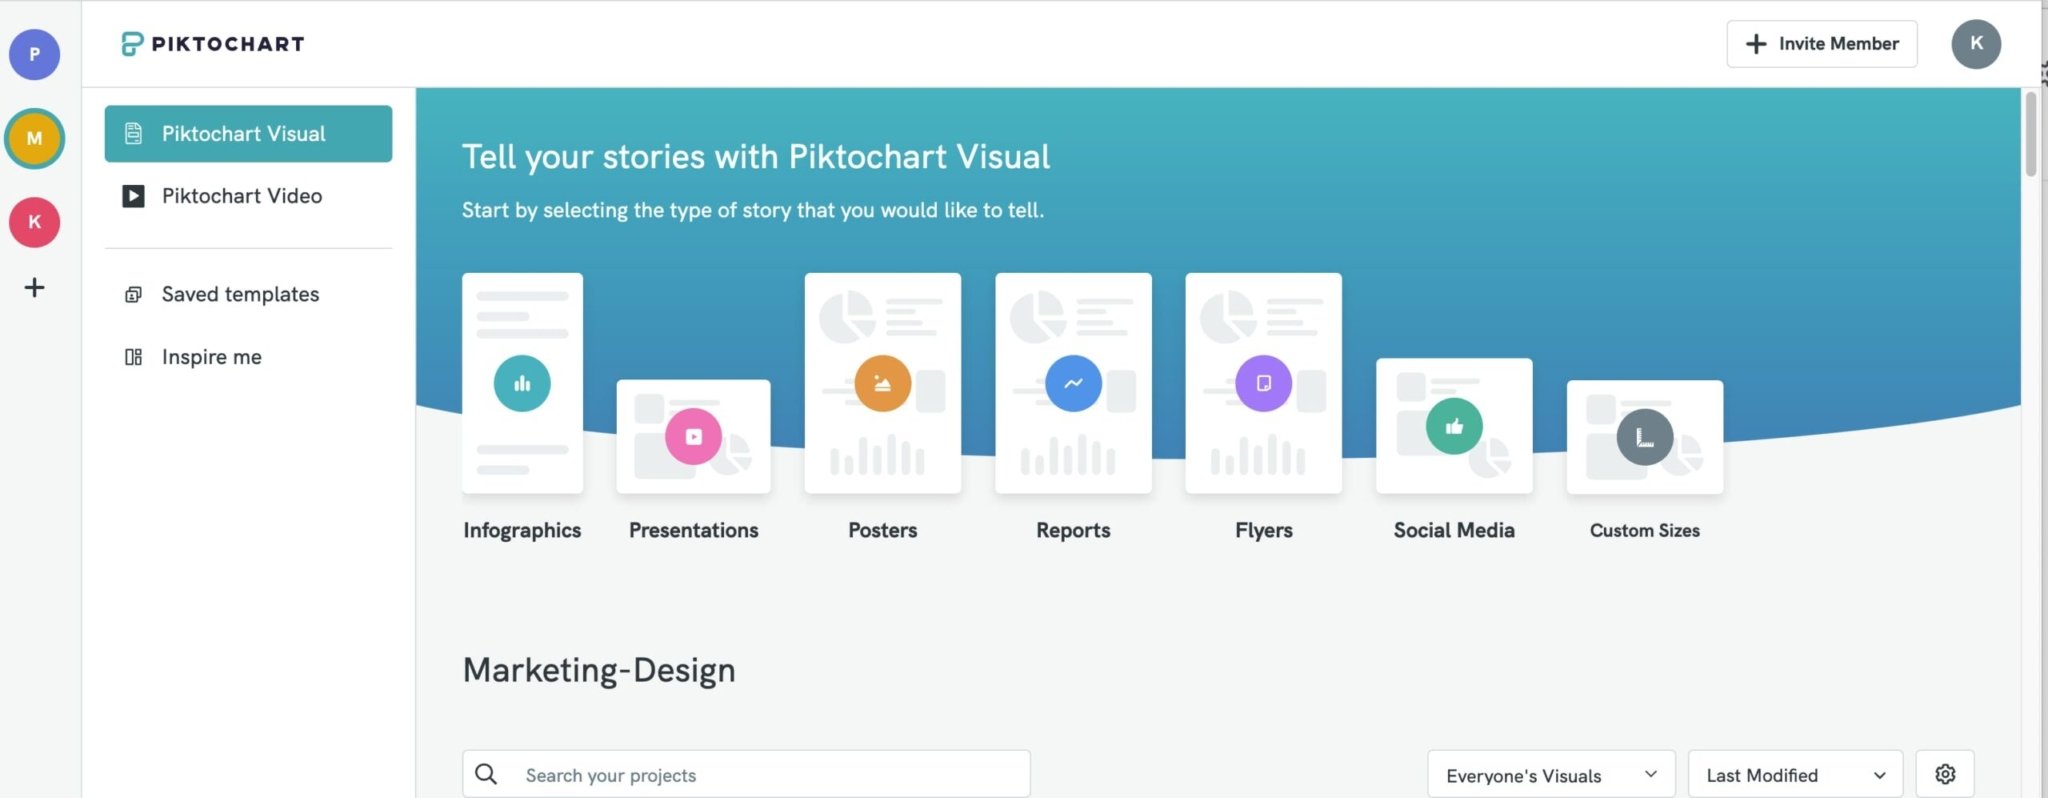
4. Piktochart Online Graph Maker
Piktochart is a versatile online graph maker that enables users to create interesting, customizable graphics including charts and infographics. Piktochart serves as a canvas for non-artists to create beautiful, high-quality visuals without needing a professional designer’s skills set.
4.1 Pros
- Templated designs: Piktochart provides a variety of templates, making the graph creation process quick and easy.
- User-friendly interface: Its drag-and-drop design makes the tool accessible to individuals without extensive technical know-how.
- Inbuilt icons and images: It offers an extensive library of built-in icons and images that users can incorporate in their designs to make them more engaging and appealing.
- High-quality output: Piktochart excels in producing high-resolution images, which is beneficial for presentations and printouts.
4.2 Cons
- Internet Dependent: Being an online tool, Piktochart requires a stable internet connection to function properly.
- Limited free version: While the tool hosts a free version, the access to features and options are limited unless upgraded to the paid version.
- Complex graphics: Piktochart is not well-suited for creating complex graphs and diagrams, where deep customization and advanced features are needed.
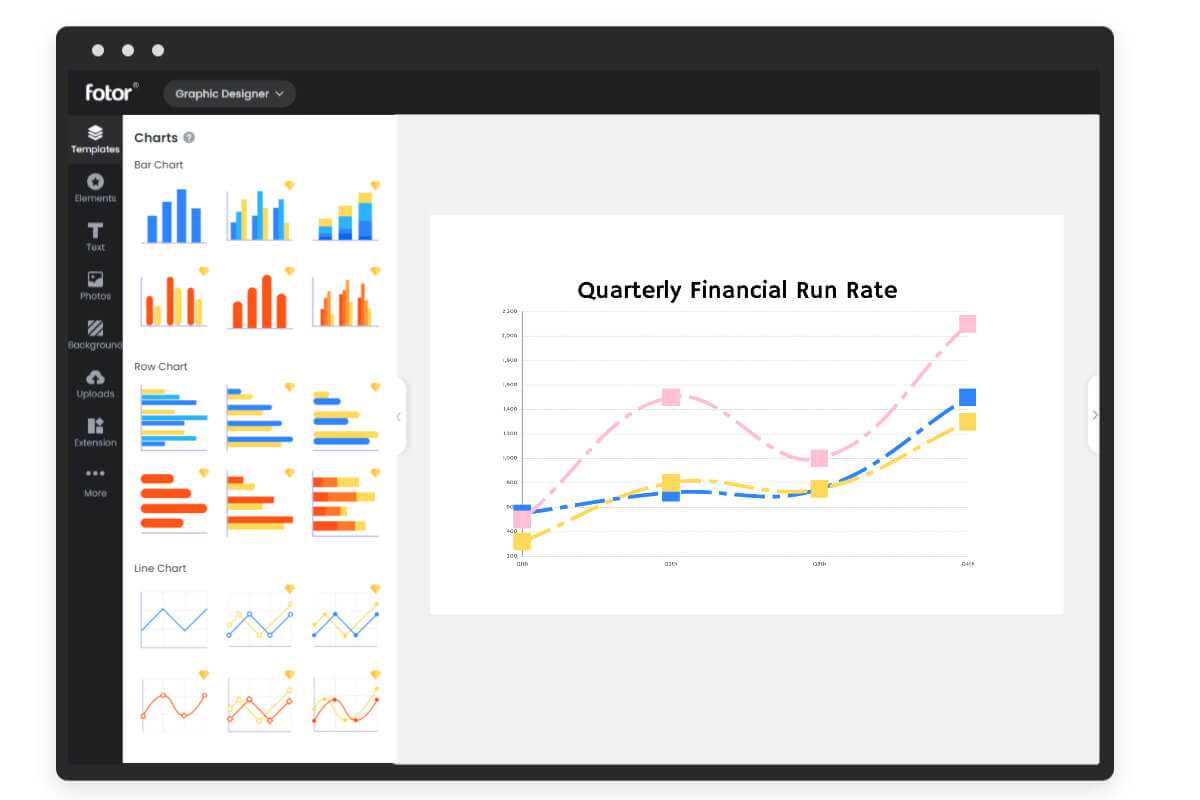
5. Fotor Online Graph Maker
Fotor is an all-in-one online graphic design and image editing tool, which includes features for creating custom graphs. It’s also known for its photo editing capabilities, with Photoshop-like features included in its suite. Fotor is suitable for individuals and small businesses searching for a multi-purpose design tool that can create graphics and edit pictures.
5.1 Pros
- Fotor for graphics and photos: Fotor is not exclusively a graph maker; rather, it’s a full-featured image editing tool, making it a one-stop shop for all graphic needs.
- Templates: Fotor provides an array of template options for charts and infographics, simplifying the design process for users.
- User-friendly interface: The tool is straightforward to navigate; even newcomers can easily understand how to use the features.
- Advanced image editing features: Fotor’s image editor is comparable to Photoshop in its capabilities, providing many options for image manipulations.
5.2 Cons
- Preserves quality exclusively for pro users: High-resolution exports and quality preservations are available exclusively to paid users.
- Ad-filled free version: The free version of the tool is filled with ads which hinder the user experience.
- Not specifically designed for graphs: Being primarily an image editing tool, although it includes graph maker features, you might not find some in-depth charting functionalities offered by dedicated graph-making software.
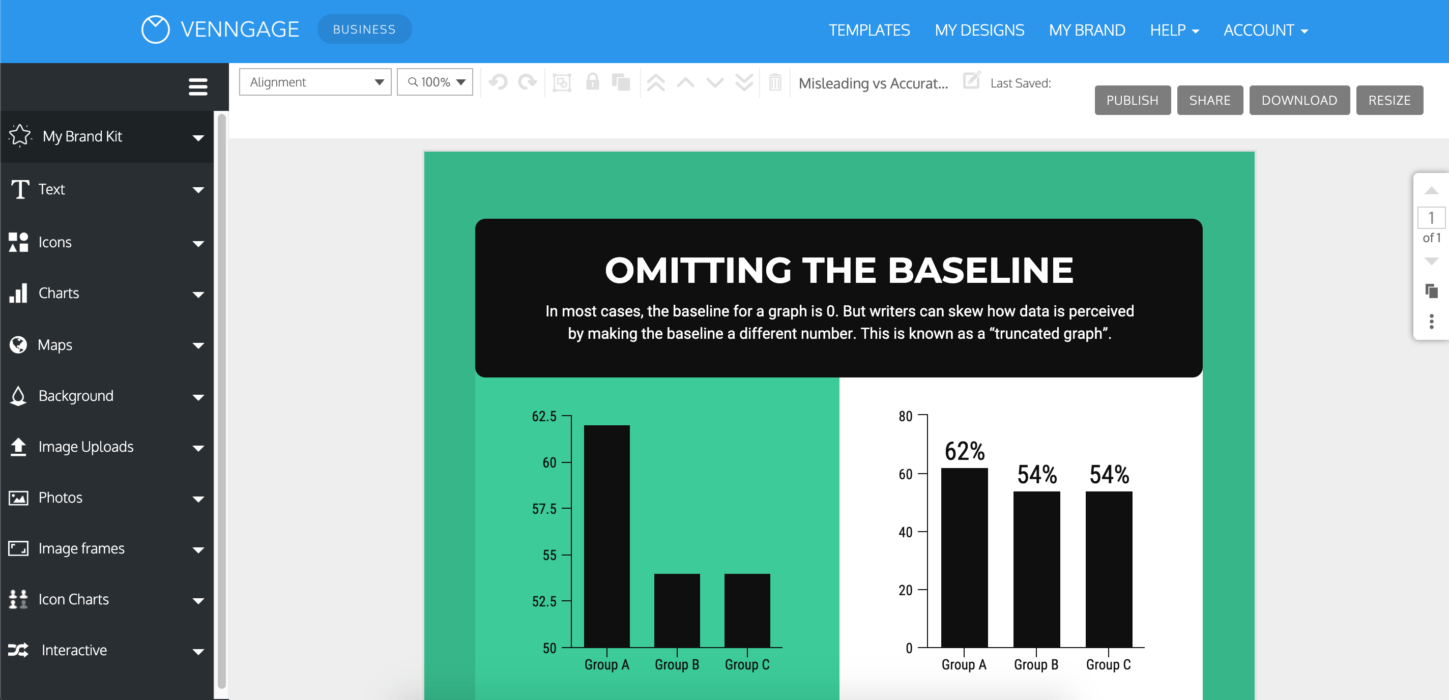
6. Venngage Free Online Graph Maker
Venngage is a free online graph maker that allows users to design and publish infographics, charts, reports, and more. Venngage specializes in transforming dry, complex data into visually stunning, easy-to-understand infographics. It provides a variety of templates to help users get started quickly, and offers quite a wide range of customization options for charts.
6.1 Pros
- Intuitive user interface: Venngage offers a user-friendly environment suitable for both novices and professionals, making graph creation a breeze.
- Wide selection of templates: The tool provides a myriad of ready-made templates, making it quick and straightforward to create visually appealing graphs.
- Extensive library of icons: Venngage boasts a library of thousands of icons that can be easily added to graphs, enhancing their visual appeal.
- Inbuilt guide: It’s accompanied by helpful tips and guides that are beneficial, particularly for those new to data visualization.
6.2 Cons
- Limitations in the free version: All features of Venngage are not available in the free version, certain advanced design features require a paid upgrade.
- Slow performance: Users have reported the tool can be somewhat slow, especially when handling larger data sets.
- Exporting issues: There have been reports of some issues or restrictions with exporting the finished graphs, which can affect the overall user experience.
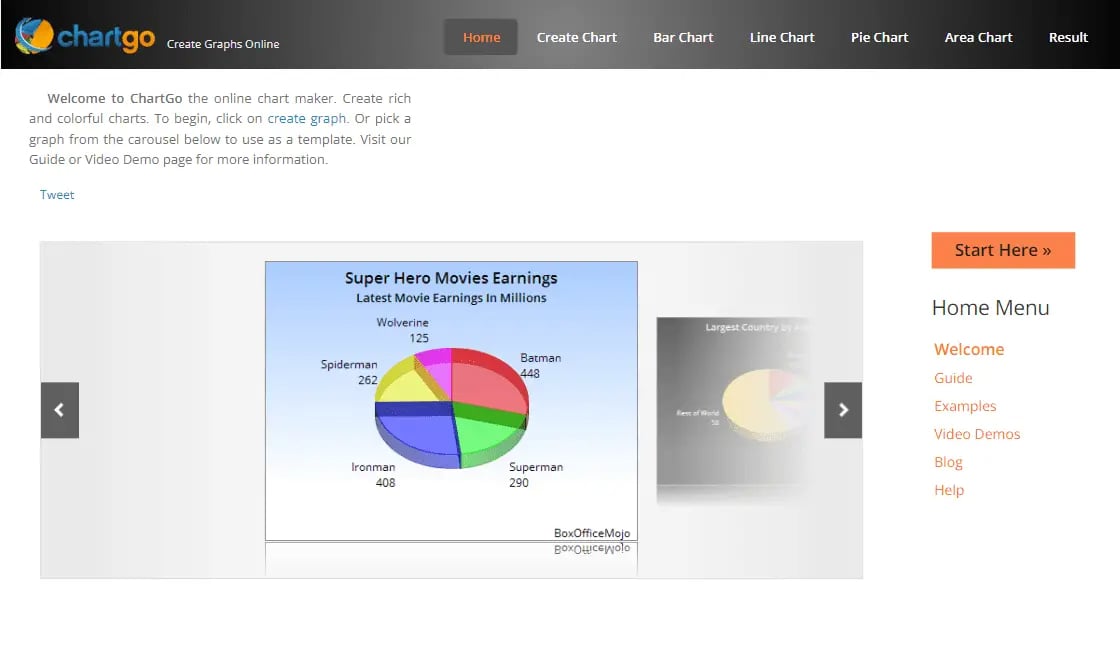
7. ChartGo Online Chart Maker
ChartGo is an intuitive online chart making tool that is well-suited for quick and simple chart generation. It offers a streamlined interface, and creates charts in a few easy steps by simply inputting your data. Its simplicity and ease-of-use make ChartGo a viable choice for users seeking a straightforward solution for effective chart creation.
7.1 Pros
- Simple interface: ChartGo has an uncomplicated and intuitive interface, making it ideal for those looking for quick chart creation.
- No registration needed: The ability to create charts without setting up an account allows instant use of the service.
- Various chart types: Despite the simplicity, ChartGo supports the creation of several types of charts, including line, bar, and pie charts.
- Image format output: Charts can be exported as image files for easy inclusion in reports and presentations.
7.2 Cons
- Limited customization: Compared to other tools, customization options are relatively limited, impeding the creative flexibility.
- Basic Feature Set: The feature set is limited, mainly focusing on basic chart creation, and might not suffice for more complex graphs.
- No data storage: ChartGo does not store data or chart configurations, making it difficult to revise and update charts.
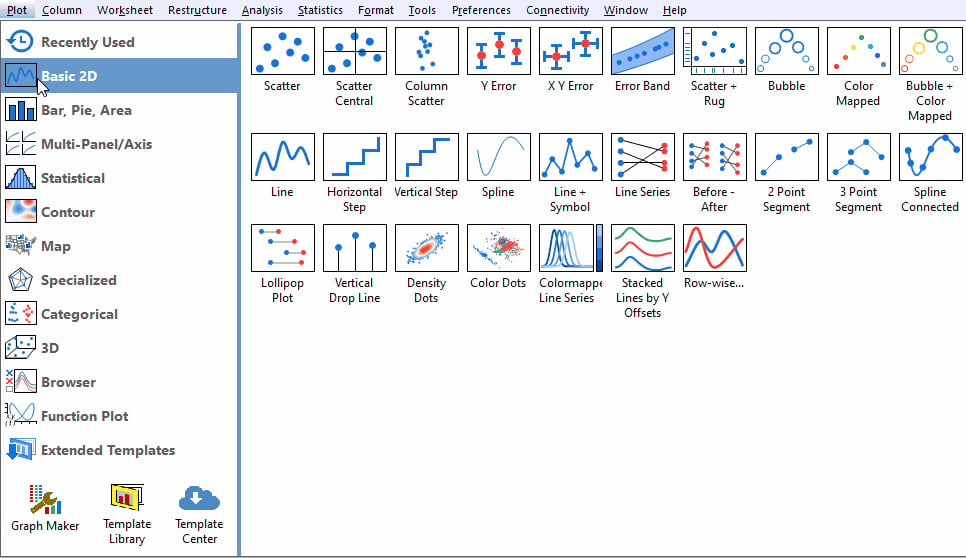
8. Origin and OriginPro
Origin and OriginPro, developed by OriginLab, provide a comprehensive solution for creating customized graphs and performing advanced data analysis. They are widely accepted tools in the scientific community due to their extensive functionality and precision, making them suitable for both data exploration and presentation.
8.1 Pros
- Advanced graphing capabilities: Origin allows users to create highly advanced, detailed, and custom graphs, beyond the capabilities of standard graph software.
- Data Analysis: Apart from graphing, OriginPro also offers a variety of data analysis tools which are beneficial for researchers and analysts.
- Batch plotting: You can generate same-style graphs from multiple data sets, saving time when dealing with high-volume data.
- Compatibility: Origin software has impressive compatibility with various data formats and includes integration with LabTalk, Python and C, offering greater flexibility.
8.2 Cons
- High learning curve: Due to its advanced functionality, Origin software has a steep learning curve compared to more simplistic graphing tools.
- Cost: Instead of a monthly licensing fee, OriginLab charges a hefty one-time payment for their software, which might be expensive for some users.
- Complex interface: The interface can seem cluttered and overwhelming to new users due to its abundance of tools and features.
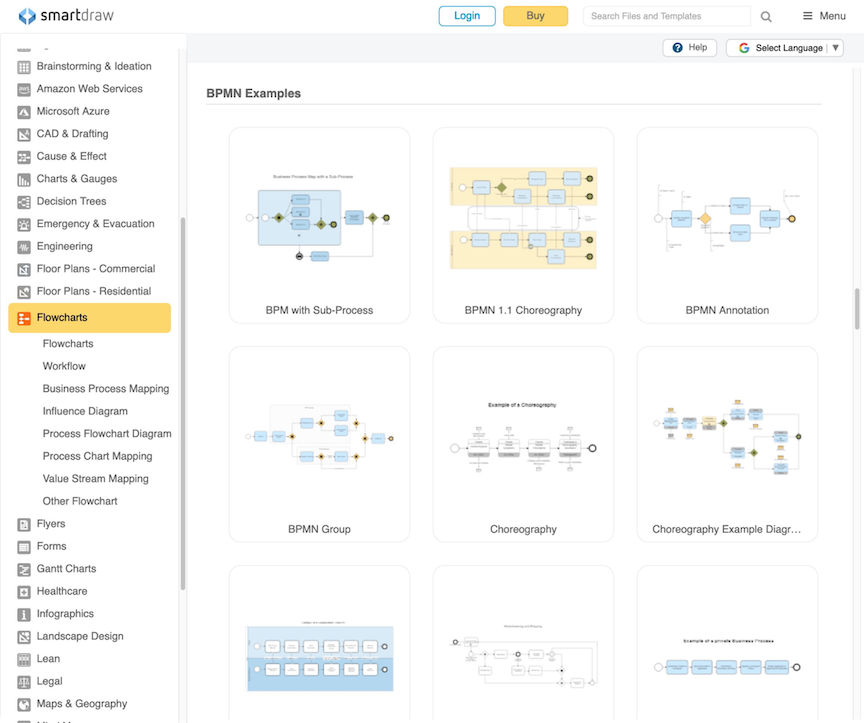
9. SmartDraw Excel Graph Creator
SmartDraw is a powerful online chart maker that specializes in diagramming and visualization. Its advanced features allow you to create all types of professional-quality graphs from directly within your Excel data, making it ideal for users who are looking for robust graph creation features enhanced by the power of Excel.
9.1 Pros
- Integration with Excel and other apps: SmartDraw is compatible with Excel for streamlined data importing and it also integrates with popular tools like Google Docs, MS Office, and others.
- Large selection of templates: The tool features an extensive library of templates that cover a wide range of chart types and styles.
- Collaborative functions: SmartDraw supports multiple collaborative features such as comments and sharing, perfect for team-based projects.
- Automatic formatting: Charts and diagrams can be automatically formatted, saving users valuable time.
9.2 Cons
- Cost: The tool is not free, which might deter some users. The different functions and advanced tools come at an expense.
- Complex Tool: Users might experience a learning curve due to its extensive features and functionalities.
- Performance issue: Users have reported performance issues at times with the software taking extra time to load and respond.
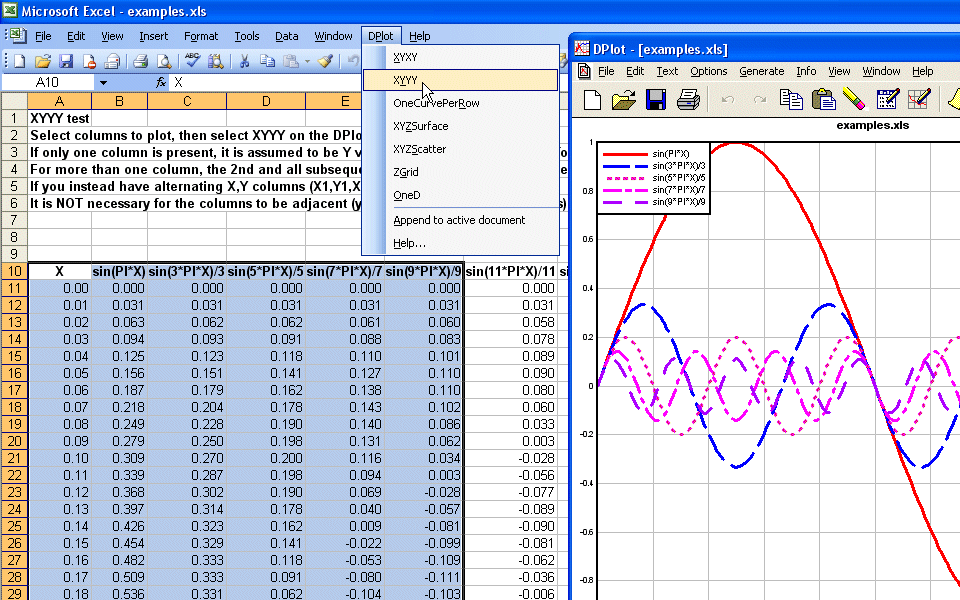
10. DPlot
DPlot is a software designed for scientists, engineers, and students for data visualization and manipulation. DPlot’s Excel add-in allows users to create a wide variety of different graph types from Excel data. Including combinations of 2D and 3D plot types, DPlot provides an extensive framework for data visualization.
10.1 Pros
- Extensive Plotting Capabilities: DPlot offer users a range of plotting options, including 2D, 3D, polar, contour and surface plots.
- Data Manipulation Functions: The tool provides a variety of data manipulation functions inclusive of FFT, filtering, and smoothing features.
- Accurate Data Representation: DPlot is recognized for its ability to handle large data sets, providing accurate and detailed graphical representation.
- Excel Integration: The software has an Excel add-in making the process of creating graphs from Excel data more effortless and efficient.
10.2 Cons
- Outdated Interface: The interface of DPlot can seem outdated to some users, potentially making navigation harder than modern interfaces.
- Cost: Unlike some other graphing tools, DPlot is not free and requires a purchase.
- Learning Curve: DPlot’s abundance of features may pose a steep learning curve for new users.
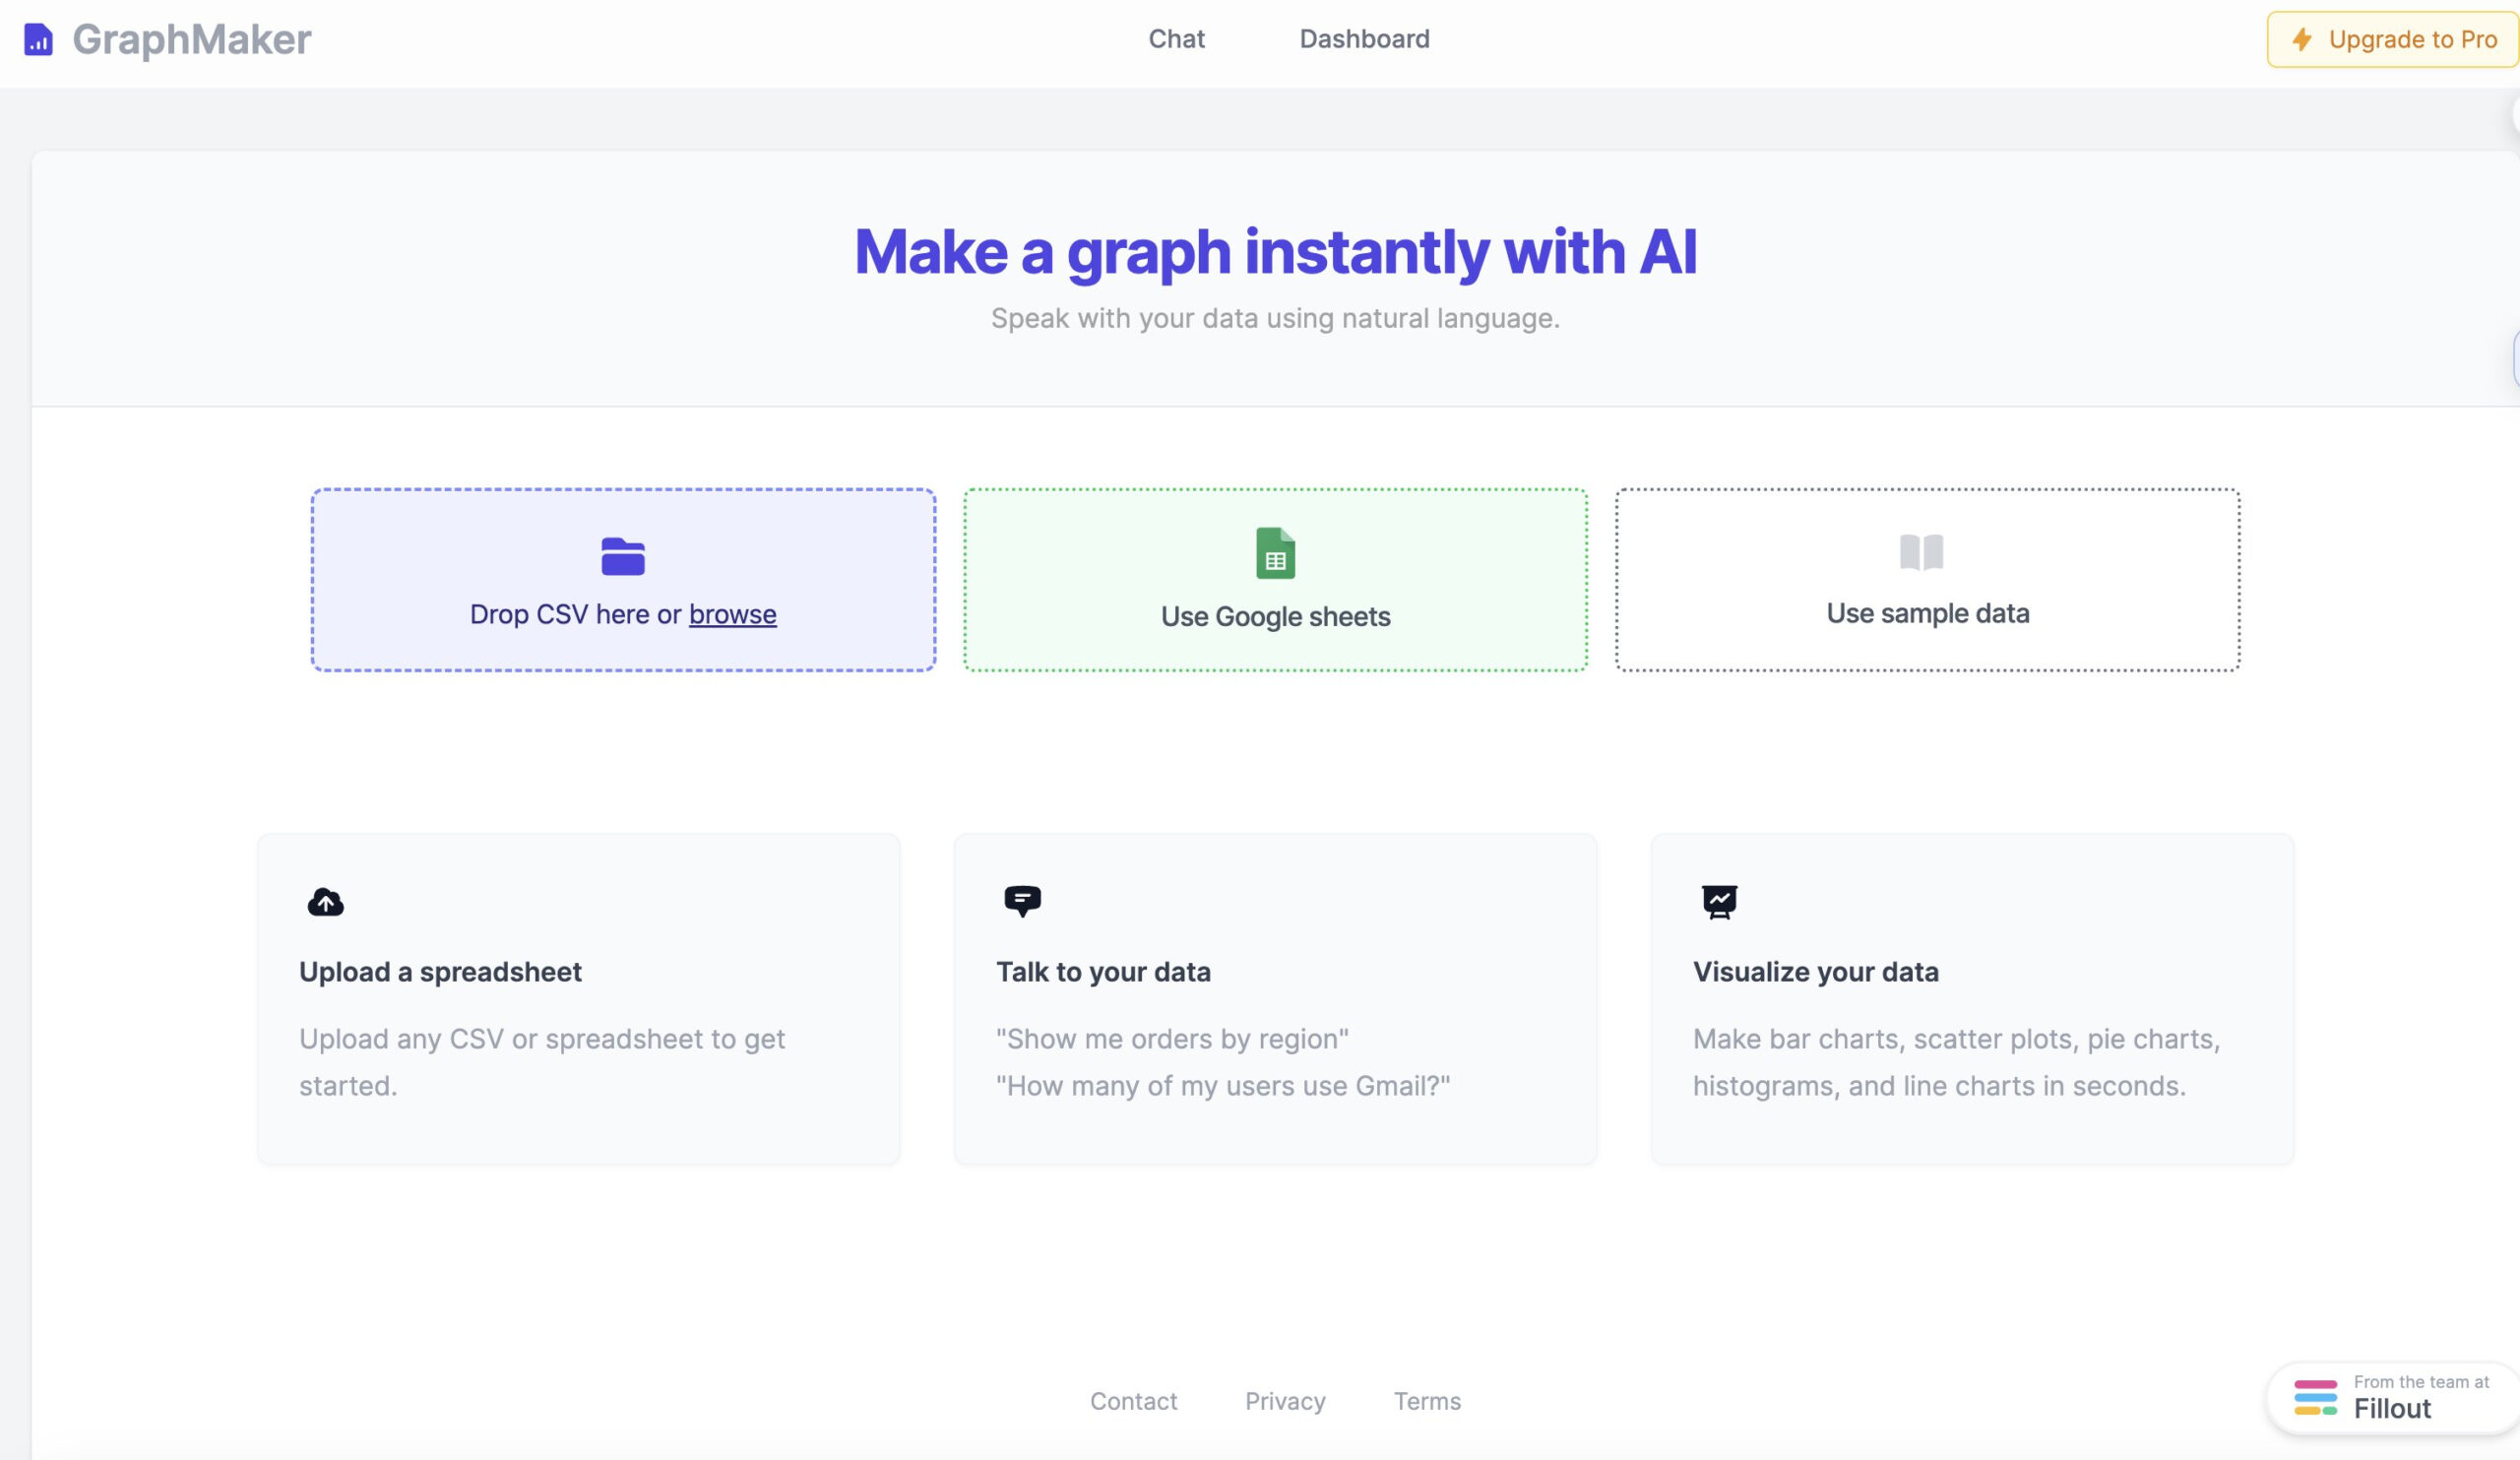
11. GraphMaker Excel Graph Creator
GraphMaker is a powerful and intelligent tool that simplifies the process of creating graphs from Excel data. Designed with artificial intelligence, this tool automatically generates charts based on your dataset. Its aim is to help users turn raw data into insightful and visually appealing graphs, and quickly identify trends and patterns in their data.
11.1 Pros
- AI-Powered: GraphMaker utilizes artificial intelligence to interpret data and create suitable graphs, easing the graph generation process.
- User-friendly interface: The easy-to-use interface is designed for both experienced and inexperienced users.
- Automation: It automates the process of reading data fields, interpreting them, and creating an engaging visual summary.
- Insightful data visualization: The created graphs are not only visually appealing, but also highly insightful, helping users identify patterns and trends in their data.
11.2 Cons
- Limited customisation options: Although the tool automatically creates graphs, users have reported fewer options for customizing graphs compared to other tools.
- Dependency on AI: Since the tool is AI-based, there can be instances when AI makes decisions about the type of graph that may not align with users’ requirements.
- Connectivity requirements: As it’s an online tool, users need a stable internet connection to use GraphMaker.
12. Moqups Free Online Graph Maker
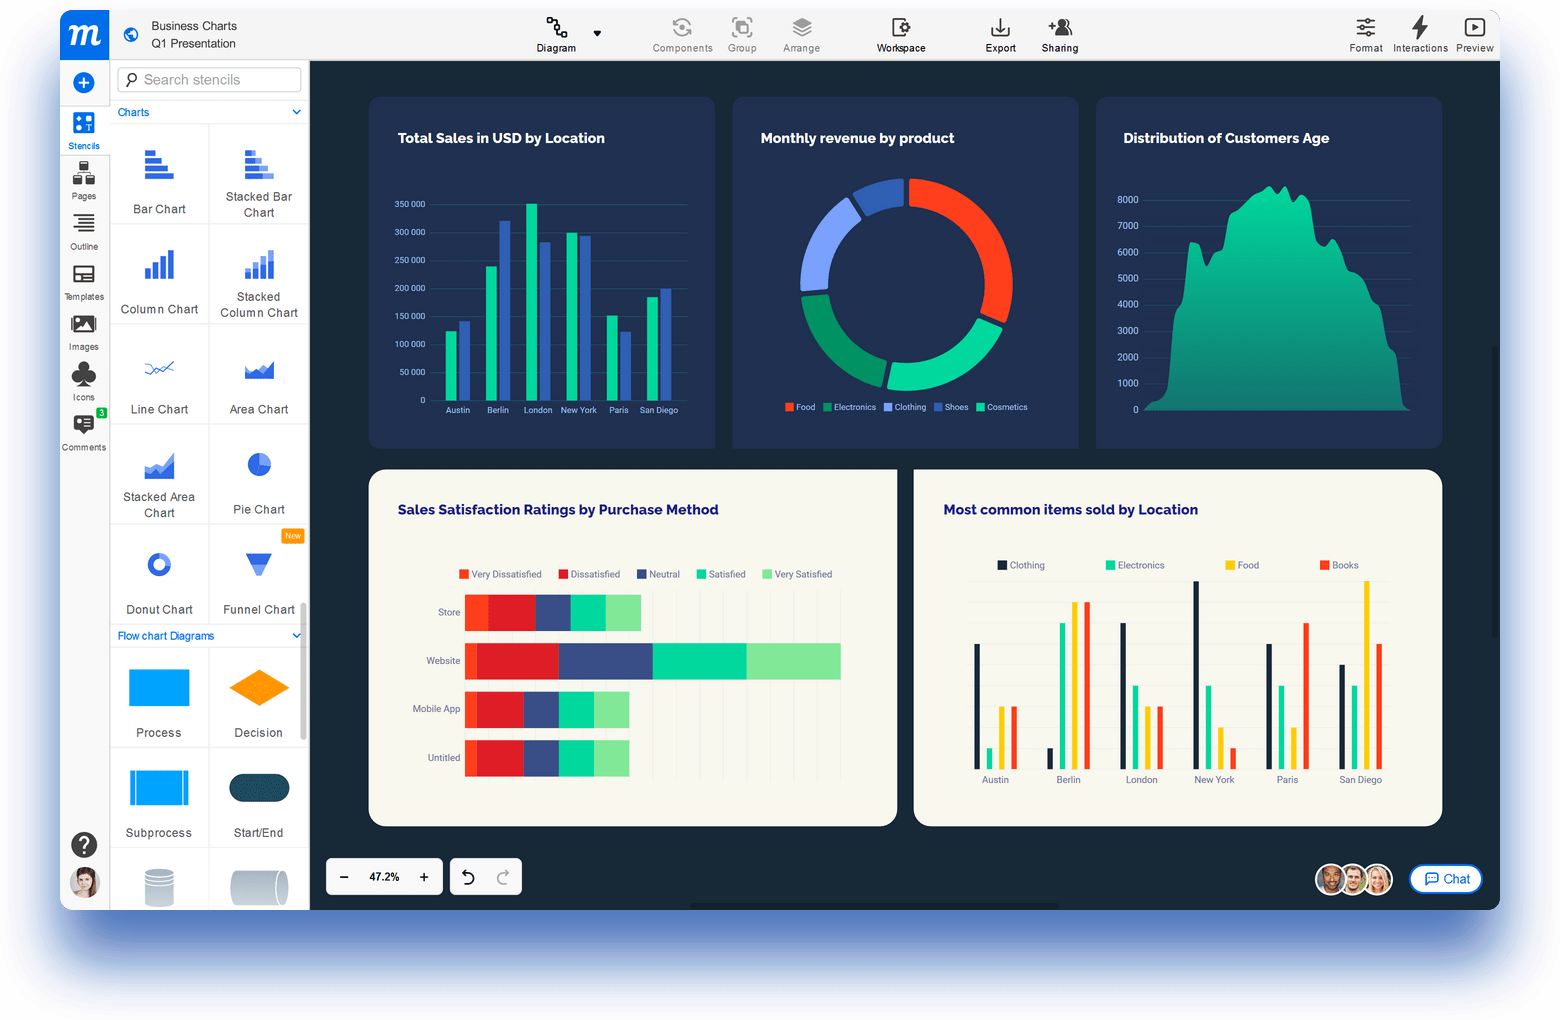
Moqups is a versatile online tool famous for its functionality in creating mockups, diagrams, and prototypes. Alongside its staple features, it also includes a graph maker allowing you to produce compelling visual representations of data. The tool’s unique feature is its seamless transition from ideation phase to implementation phase all within the same workspace.
12.1 Pros
- Multifunctional: Apart from graph creation, Moqups can be also used for making wireframes, diagrams, and mockups.
- Interactive Canvas: It offers an expansive, unobstructed canvas allowing great flexibility for placing objects and creating designs.
- Team Collaboration: Moqups features a robust set of collaboration tools, making it easy to work with teams.
- Intuitive UI: The user-friendly interface of the application ensures a smooth user experience.
12.2 Cons
- Limited Free Version: The free version of Moqups comes with restricted features and users must upgrade to access all functionalities.
- Internet Dependent: As it’s a web-based application, continuous internet connectivity is required for uninterrupted usage.
- Not specifically built for graphing: While it does offer graph-making capabilities, the primary focus of Moqups is prototyping and mockup design, possibly limiting its graph-making potential.
13. Summary
13.1 Overall Comparison Table
| Tool | Features | Ease of Use | Price | Customer Support |
|---|---|---|---|---|
| Visme Online Graph Maker | Highly customizable, wide variety of templates | Easy | Free version available, Paid version for more features | Good |
| LiveGap Charts Excel Graph Creator | Simple graph creation, variety of chart types | Easy | Free | Limited |
| Piktochart Online Graph Maker | Wide range of templates, inbuilt icons and images | Easy | Free version available, Paid version for full access | Good |
| Fotor Online Graph Maker | Advanced image editing features, variety of templates | Easy | Free version available, Paid version for ad-free & high quality | Good |
| Venngage Free Online Graph Maker | Templated designs, inbuilt guides | Easy | Free version available, Paid version for more features | Good |
| ChartGo Online Chart Maker | Basic chart types, image export | Easy | Free | Limited |
| Origin and OriginPro | Advanced graphing, data analysis tools | Medium | One-time payment required | Good |
| SmartDraw Excel Graph Creator | Wide range of templates, integration with excel and other apps | Easy | Paid | Good |
| DPlot | Advanced plotting capabilities, data manipulation functions | Medium | Paid | Good |
| GraphMaker Excel Graph Creator | AI-powered Graph maker, automation | Easy | Free | Limited |
| Moqups Free Online Graph Maker | Multifunctional tool, team collaboration | Easy | Free version available, Paid version for more features | Good |
13.2 Recommended Tool Based on Various Needs
For beginners: If you’re a beginner looking for an easy-to-use tool, then Visme or Piktochart would be ideal, as they offer a user-friendly interface and a variety of ready-made templates.
For scientists and researchers: For those in search of more analytical functionalities and advanced features, software like Origin and OriginPro or DPlot would be your best bet.
For budget-conscious users: Users on a budget can utilize free tools like LiveGap Charts, ChartGo, or the free versions of many of the mentioned tools.
For AI-driven automation: If you’re looking for automation in graph creation, GraphMaker can be a perfect choice with its AI-powered features.
For team collaboration: For those in team settings, the collaboration feature of Moqups would be of great use.
14. Conclusion
14.1 Final Thoughts and Takeaways for Choosing an Excel Graph Creator
Choosing the right Excel graph creator is a decision that should be based on your unique needs and requirements. Bear in mind specific criteria like the ease-of-use, the variety of features, the customer support, and the pricing model. If you’re a beginner, consider tools with an intuitive interface and ready-made templates. If you’re a professional or researcher, opt for tools offering advanced features and intricate plotting capabilities. Budget-conscious users might want to utilize free tools while teams might favor tools with collaborative features.

Every tool mentioned in this comparison has its distinct strengths, addressing different needs and preferences. You might need to try out several of these before settling on the one that aligns perfectly with your needs. In the world of digital data, having the right tool to effectively visualize your data in a meaningful and understandable way is of utmost importance. Therefore, it is important to take an informed decision when choosing the most suitable Excel graph creator for your needs.
Author Introduction:
Vera Chen is a data recovery expert in DataNumen, which provides a wide range of products, including a powerful tool to repair DWG files.