1. Introduction to SQL Server Profiler
1.1 What is SQL Server Profiler and Why We Need It?
SQL Server Profiler is a graphical user interface tool for monitoring and capturing events that occur within SQL Server. This powerful diagnostic tool allows database administrators and developers to observe database engine activity in real-time, helping identify performance bottlenecks, troubleshoot application issues, and audit security events.
1.2 SQL Server Profiler in 2025: Current Status and Alternatives
Microsoft deprecated SQL Server Profiler starting with SQL Server 2016, recommending Extended Events as the replacement technology. However, the tool remains available in current SQL Server versions including SQL Server 2022 and is still widely used by database professionals.
1.3 Who Should Use This Guide
- This guide serves database administrators who need to monitor SQL Server instances, diagnose performance issues, and ensure system reliability. DBAs will find practical guidance for capturing traces, analyzing events, and implementing monitoring strategies.
- Application developers benefit from understanding how their code interacts with SQL Server. The SQL Profiler helps developers identify inefficient queries, validate application behavior, and debug database-related errors.
- Performance analysts and consultants will discover advanced techniques for workload analysis, capacity planning, and system optimization. The comprehensive coverage of trace configuration, filtering, and analysis enables thorough database performance assessments.
2. Understanding SQL Server Profiler Fundamentals
2.1 How SQL Server Profiler Works
SQL Server Profiler operates as a client application that connects to the SQL Trace engine running within SQL Server. When you create a trace, the database engine monitors specified events and captures them according to your configuration. The trace engine collects event data with minimal impact on server performance when properly configured.
The underlying SQL Trace infrastructure uses lightweight event hooks throughout the database engine. When an event occurs that matches your trace definition, the engine captures relevant information and either sends it to the Profiler interface or stores it to a file or table. This architecture allows flexible data collection without modifying application code.
2.2 Key Concepts and Terminology
2.2.1 Events
Events represent specific occurrences within SQL Server that the trace engine can capture. Each event corresponds to a particular database operation or system activity. SQL Server Profiler organizes events into logical categories for easier configuration.
Common event categories include TSQL for query execution, Stored Procedures for procedure calls, Locks for concurrency monitoring, and Errors and Warnings for exception tracking. Selecting appropriate events determines what information your trace captures and directly impacts the trace’s usefulness and performance overhead.
Understanding event types helps you configure effective traces. RPC:Completed events capture remote procedure call completions, SQL:BatchCompleted events track ad-hoc query batches, and Lock:Deadlock events identify deadlock occurrences. Choose events that align with your specific troubleshooting or monitoring objectives.
2.2.2 Data Columns
Data columns define what information the trace captures for each event. Common columns include TextData for the actual SQL statement, Duration for execution time, CPU for processor utilization, Reads for logical disk reads, and Writes for logical disk writes.
Essential columns vary by use case. Performance troubleshooting typically requires Duration, CPU, Reads, and Writes columns. Security auditing needs LoginName, DatabaseName, and ObjectName columns. Application debugging benefits from ApplicationName, SPID, and Error columns.
Selecting only necessary columns reduces trace overhead and simplifies analysis. Avoid capturing all available columns unless specifically needed. Each additional column increases the amount of data collected and processed, potentially impacting server performance.
2.2.3 Filters
Filters restrict which events the trace captures based on specified criteria. Properly configured filters dramatically reduce trace volume, making analysis manageable and minimizing performance impact. Filters evaluate event data before capture, preventing unnecessary data collection.
Common filter criteria include DatabaseName to focus on specific databases, ApplicationName to isolate particular applications, Duration to capture only slow operations, and LoginName to track specific users. Combining multiple filters creates precise trace definitions that capture exactly what you need.
Performance-conscious filtering is essential for production environments. Always filter by DatabaseName or ApplicationName to avoid capturing system activity. Set minimum Duration thresholds to ignore fast-executing queries. Use TextData filters cautiously as they require string comparisons that add overhead.
2.2.4 Trace Templates
Trace templates provide pre-configured event, column, and filter selections for common scenarios. SQL Server Profiler includes several built-in templates that serve as starting points for trace creation. Custom templates save your configurations for reuse across multiple tracing sessions.
The Standard template captures a general set of events suitable for basic monitoring. The TSQL template focuses on query execution with minimal overhead. The Tuning template collects events specifically for Database Engine Tuning Advisor analysis. Each template balances information capture against performance impact.
Creating custom templates saves time and ensures consistency across tracing sessions. Configure a trace with your preferred events, columns, and filters, then save it as a template. Custom templates become particularly valuable when you repeatedly troubleshoot similar issues.
3. Getting Started with SQL Server Profiler
3.1 System Requirements and Prerequisites
SQL Server Profiler comes bundled with SQL Server Management Studio and supports all currently maintained SQL Server versions, from SQL Server 2016 to 2022.
Permission requirements determine who can create and run traces. Members of the sysadmin fixed server role have unrestricted access to SQL Server Profiler functionality. For non-sysadmin users, the ALTER TRACE permission grants the ability to create and manage traces.
Network considerations apply when tracing remote servers. Client-side traces require continuous network connectivity between your workstation and the SQL Server instance. Interrupted connections stop client-side traces, potentially losing captured data. Server-side traces avoid this limitation by running entirely on the database server.
3.2 How to Launch SQL Server Profiler
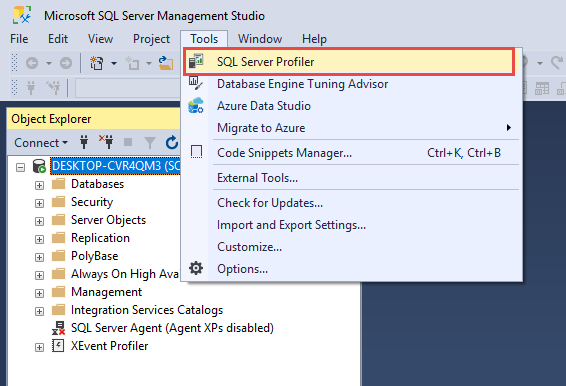
3.2.1 Starting from SQL Server Management Studio (SSMS)
Follow these steps to launch SQL Server Profiler from SSMS:
- Open SQL Server Management Studio and connect to any SQL Server instance.
- Click the Tools menu in the top menu bar.
- Select SQL Server Profiler from the dropdown menu.
- The SQL Server Profiler application launches in a new window.
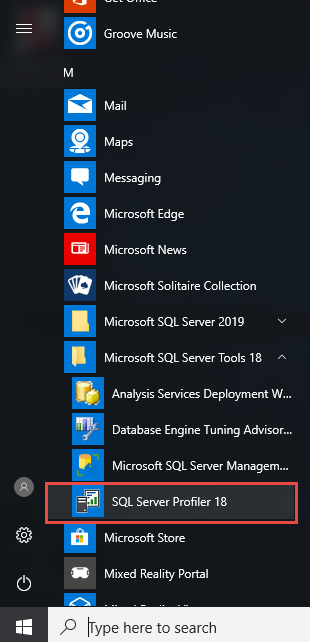
3.2.2 Starting from Windows Start Menu
Access SQL Server Profiler directly from Windows using these steps:
- Click the Windows Start button.
- Type SQL Server Profiler in the search box.
- Select SQL Server Profiler from the search results.
- The application launches with no active connections.

Alternatively, navigate through the Start menu hierarchy:
- Open the Start menu.
- Locate the Microsoft SQL Server Tools folder.
- Expand the folder and click SQL Server Profiler.
3.2.3 Connecting to SQL Server Instances
After launching SQL Server Profiler, establish a connection following these steps:
- Click File in the menu bar.
- Select New Trace from the dropdown menu.
- The Connect to Server dialog appears.
- Enter your server name in the Server name field.
- Choose Windows Authentication or SQL Server Authentication.
- If using SQL Server Authentication, enter your login credentials.
- Click Connect to establish the connection.

For remote connections, specify the full server name including instance name if applicable. Use the format SERVERNAME\INSTANCENAME for named instances. Verify network connectivity and firewall settings if connection attempts fail.
4. Creating and Configuring SQL Server Traces
4.1 Creating Your First Trace Using a Template
Create your first trace using these steps:
- Launch SQL Server Profiler.
- Click File -> New Trace and connect to your target server.
- The Trace Properties dialog appears.
- Enter a descriptive name in the Trace name field.
- Select a template from the Use the template dropdown.
- Choose the Standard (default) template for general monitoring. Or another template for other purposes. The template provides pre-configured events, columns, and filters for common scenarios.
- Click Run to start capturing events immediately.

4.2 Customize Your Trace
Many times, the templates cannot meet your requirements. In such a case, you can fully customize your trace:
- In the Trace Properties dialog.
- Select the Blank template from the Use the template dropdown.

- Click the Events Selection tab, now you can customize all the events, data columns, and filters based on your requirements. We will discuss them in the following sections.

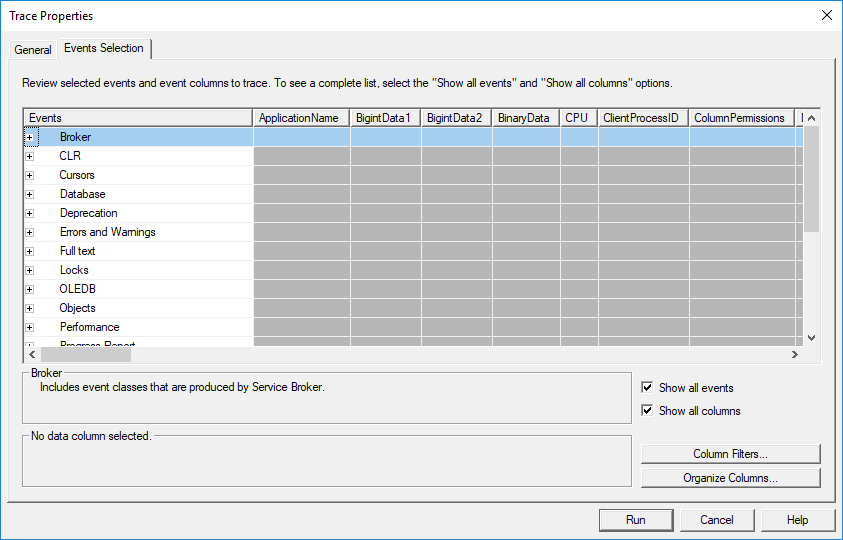
4.3 Selecting Events to Capture
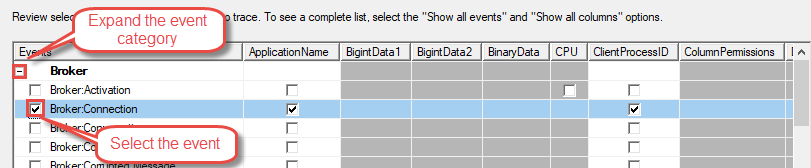
You can select an event in the Events Selection tab:
- Click the + icon beside the Event category to expand it.
- Click the checkbox beside the event to select it.
4.3.1 Understanding Event Categories
SQL Server Profiler organizes events into categories for logical grouping. The Stored Procedures category includes events for procedure execution including SP:Starting, SP:Completed, and SP:StmtCompleted. These events track stored procedure calls and individual statement execution within procedures.
The TSQL category captures ad-hoc query execution with events like SQL:BatchStarting and SQL:BatchCompleted. These events track queries submitted directly to SQL Server outside of stored procedures.
The Locks category monitors concurrency-related events including Lock:Acquired, Lock:Released, Lock:Deadlock, and Lock:Timeout. Use these events to diagnose blocking and deadlock issues affecting application performance.
The Errors and Warnings category captures exception events including Exception, Attention, and User Error Message. These events help identify application errors and SQL Server warnings during trace sessions.
4.3.2 Choosing the Right Events for Your Scenario
Performance monitoring requires events that capture resource consumption. Select RPC:Completed and SQL:BatchCompleted to track query execution. Include Duration, CPU, Reads, and Writes columns to measure resource usage. These events provide the foundation for identifying performance bottlenecks.
Security auditing demands events that track authentication and authorization. Select Audit Login, Audit Logout, Audit Login Failed, and Object:Opened to monitor database access. Include LoginName, DatabaseName, and ObjectName columns to identify who accessed what resources.
Debugging scenarios benefit from comprehensive event capture. Include stored procedure events, SQL batch events, and error events to trace complete execution flows. Capture additional context with SPID, ApplicationName, and HostName columns to correlate events with specific sessions.
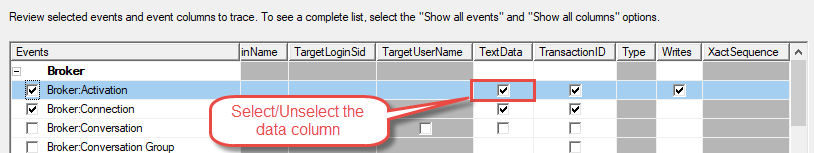
4.4 Configuring Data Columns
By default, when you select an event, all its data columns will be selected(checked). You can unselect the unnecessary columns to reduce overhead and simplify analysis:
Essential columns for every trace include EventClass to identify the event type, TextData to capture the actual SQL statement, LoginName to identify the executing user, and StartTime to timestamp when the event occurred. These columns provide fundamental context for every captured event.
Performance-related columns measure resource consumption. Duration indicates how long an event took in microseconds. CPU shows processor time in milliseconds. Reads counts logical page reads. Writes tracks logical page writes. These metrics identify resource-intensive operations requiring optimization.
Security and audit columns track data access patterns. DatabaseName identifies which database was accessed. ObjectName specifies the table or object involved. ApplicationName reveals which application initiated the activity. Together, these columns provide comprehensive audit trails.
4.5 Setting Up Filters to Reduce Noise
4.5.1 Common Filter Criteria
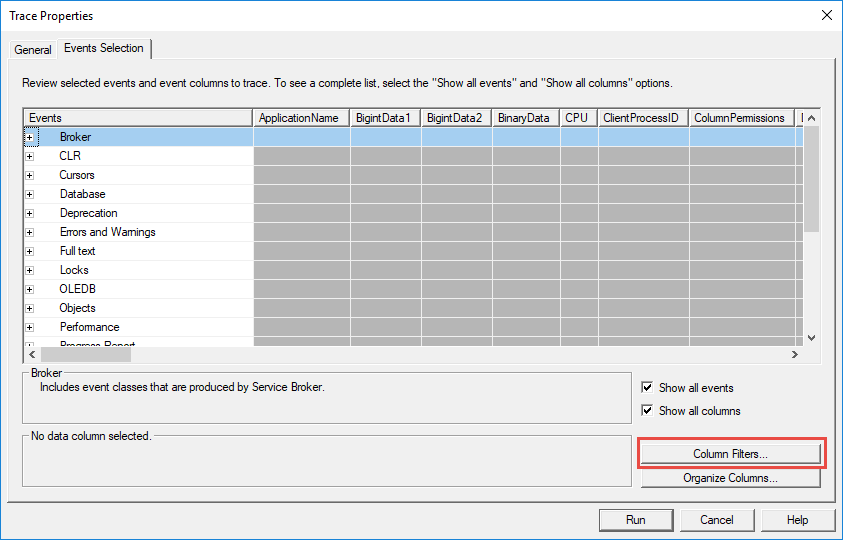
Configure filters using the following approach:
- Open the Trace Properties dialog.
- Click the Events Selection tab.
- Click Column Filters button in the bottom right.

- Select a column from the list on the left.
- Configure filter criteria in the panel on the right.

- Click OK to apply the filter.
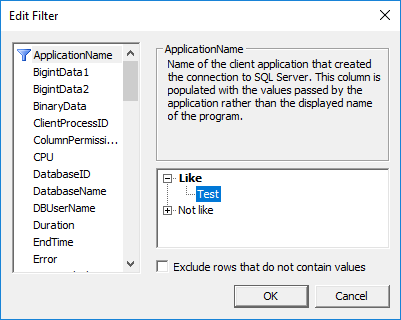
Application name filters isolate activity from specific applications. Expand the ApplicationName column in the filter dialog, enter your application name in the Like field, and SQL Server Profiler captures only events from that application. This filter proves invaluable when troubleshooting application-specific issues.
Database name filters limit capture to specific databases. Filter by DatabaseName to exclude system database activity and focus on your application databases. Enter database names in the Like or Equal field depending on whether you need wildcard matching.
Duration filters capture only slow-running operations. Set a minimum threshold in the Greater than or equal field under the Duration column. For example, setting Duration >= 1000 captures only events taking more than one second, filtering out fast-executing queries.
Username filters track specific user activity. Filter by LoginName to monitor particular database users. This approach helps identify which users execute problematic queries or access sensitive data.
4.4.2 Filter Best Practices
Effective filtering balances data capture with performance impact. Always apply at least one filter to prevent capturing excessive system activity. DatabaseName and ApplicationName filters should be your starting point for most traces.
Avoid overly broad traces in production environments. Unfiltered traces capture enormous volumes of data, potentially degrading server performance and making analysis impractical. Set specific filter criteria that target your troubleshooting objectives.
Test filters before deploying to production. Run traces against development or test environments first to verify filters capture expected events without excessive overhead. Adjust filter criteria based on the volume of data captured.
4.5 Working with Trace Templates
4.5.1 Built-in Templates Overview
The Standard template provides balanced event capture suitable for general monitoring. It includes common query execution events, stored procedure calls, and basic error tracking. Use this template when you need comprehensive visibility without knowing exactly what to look for.
The TSQL template focuses specifically on query execution with minimal event selection. It captures SQL:BatchCompleted and RPC:Completed events with essential columns for performance analysis. This template offers lower overhead than the Standard template.
The Tuning template optimizes event selection for Database Engine Tuning Advisor analysis. It captures events and columns required for workload analysis and index recommendations. Use this template when preparing traces for automated performance tuning.
The TSQL_Replay template includes all events and columns necessary for trace replay functionality. It captures comprehensive execution details enabling you to reproduce captured workloads in test environments. This template generates larger trace files due to extensive data collection.
4.5.2 Creating Custom Templates
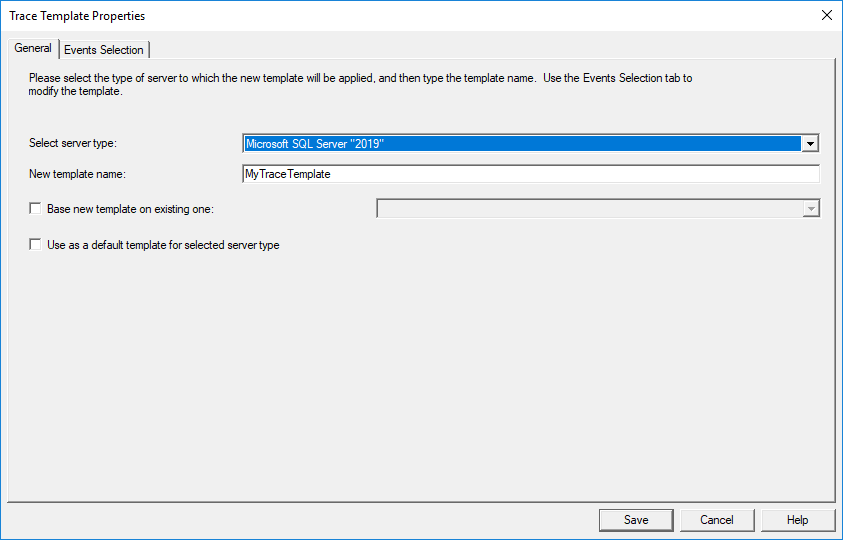
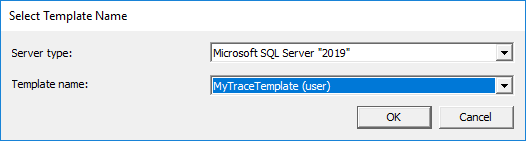
Create custom templates following these steps:
- Click File -> Templates -> New Template …
- Enter a descriptive name in the New template name field.
- Optionally, check Base new template on existing one and select an existing template if you don’t want to build from scratch:
- Click the Event Selection tab, customize the trace template with your desired events, columns, and filters just like you do with a normal trace.
- Click Save to save the template.
Export templates for sharing with team members or backup purposes:
- Click File -> Templates -> Export Template.
- Select the template you want to export.

- Navigate to your desired save location.
- Enter a filename and click Save.
- Share the *.tdf file (SQL Server Profiler template file) with other SQL Server Profiler users.
4.6 Saving Trace Output
By default, SQL Server Profiler will show the events in the trace window, but will NOT save them. You can choose to save the trace data to a file or table in the Trace Properties dialog when you create a new trace.
4.6.1 Save to File
- In the Trace Properties dialog, check Save to file.
- Click the folder icon to open the file browser.
- Navigate to your desired save location.
- Enter a filename with .trc extension.
- Click Save.
- Set Set maximum file size to limit individual file size.
- Enable Enable file rollover to create multiple files.
- Optionally enable Server processes trace data for server-side traces.
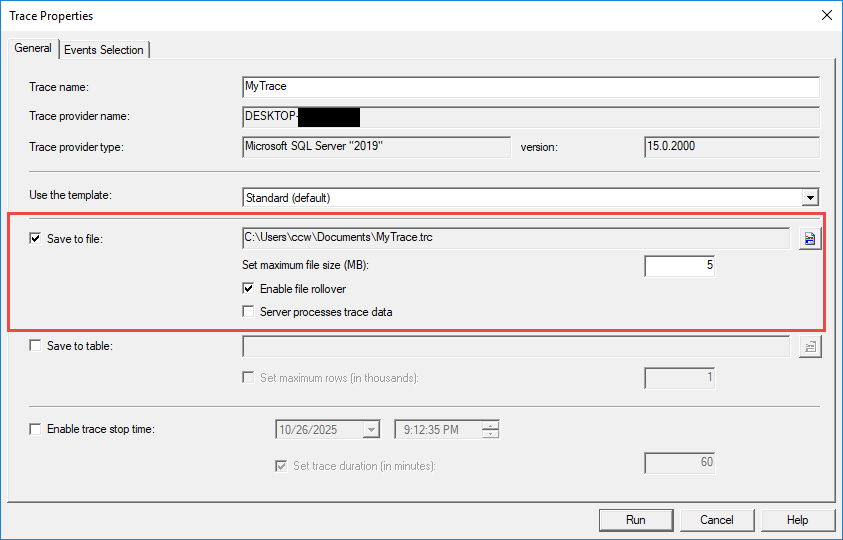
File size management prevents disk space exhaustion. Set the maximum file size to a reasonable value like 500 MB or 1 GB based on available disk space and expected trace duration. File rollover automatically creates new files when the size limit is reached, appending a number to the filename.
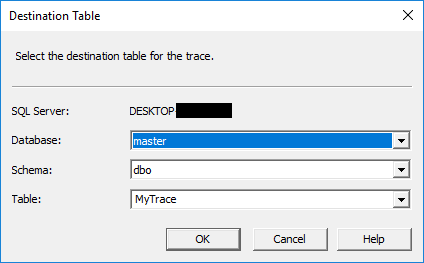
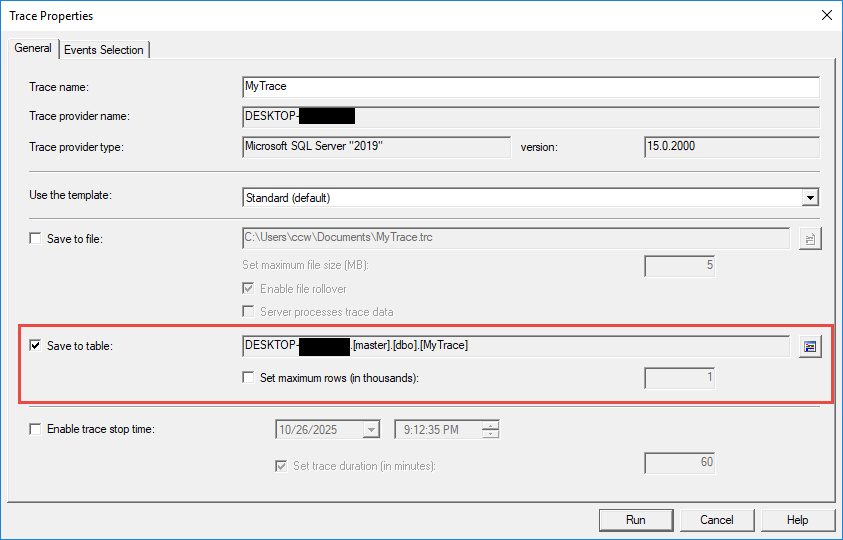
4.6.2 Save to Table
- In the Trace Properties dialog, check Save to table.
- The Destination Table dialog appears.

- Select the server from the Server dropdown.
- Choose the database from the Database dropdown.
- Select an existing table or enter a new table name in the Table field.
- Click OK to confirm.
- Optionally set Set maximum rows to limit table size.
Performance considerations apply when saving to tables. Table storage introduces additional overhead compared to file storage because SQL Server must write trace data through the storage engine. Use table storage when you need to query trace data immediately with T-SQL.
Data retention becomes important for table-based traces. Set maximum row limits to prevent tables from growing too large. Archive or delete old trace data regularly to maintain performance. Consider partitioning large trace tables for better manageability.
5. Running and Managing SQL Server Traces
5.1 Starting, Pausing, and Stopping Traces
Manage trace execution using the toolbar buttons: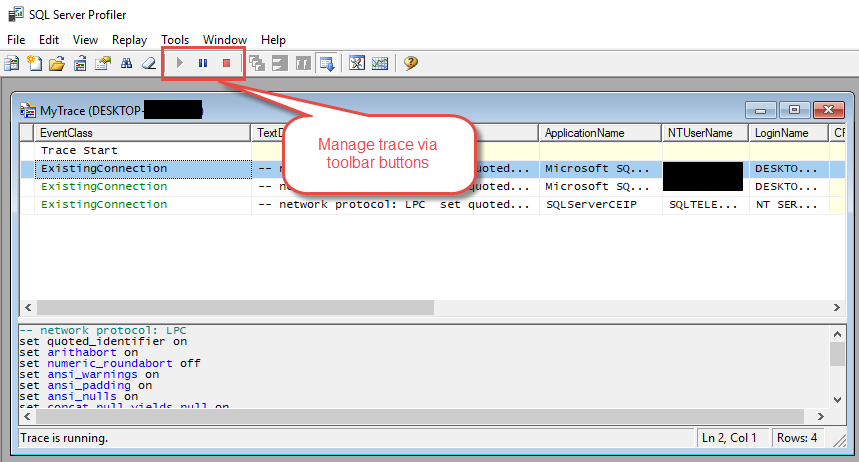
- The green Start button begins capturing events according to your configuration.
- Click Pause to temporarily suspend data collection without losing the connection.
- Click Stop to end the trace and close the connection.
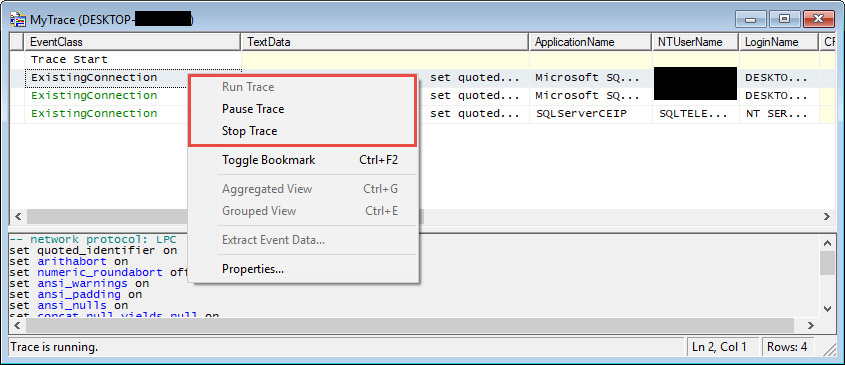
Via menu items:
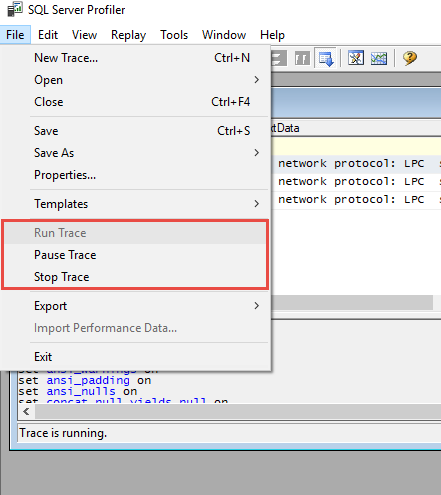
Via right-click any entry in the trace window:
Trace lifecycle management impacts server resources. Active traces consume memory and processing power proportional to the volume of events captured. Pause traces during periods when monitoring isn’t needed to reduce overhead. Stop traces completely when analysis is finished to free resources.
Client-side traces require an active Profiler connection. Closing the SQL Server Profiler window stops client-side traces immediately. Minimize the Profiler window instead of closing it to keep traces running while working in other applications.
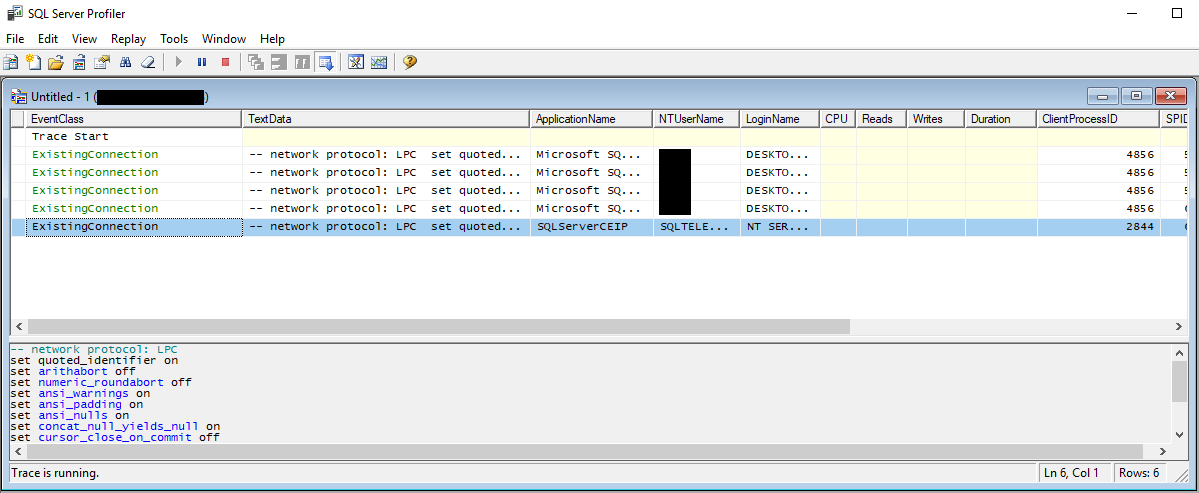
5.2 Real-Time Trace Monitoring
Monitor captured events as they occur in the main trace window. Each row represents a single event with columns displaying event properties. The grid updates continuously during active traces, showing the most recent events at the bottom by default.

Identify patterns and issues by observing event frequency and characteristics. High-duration events indicate performance problems. Frequent error events suggest application issues. Unusual login activity may signal security concerns. Real-time monitoring enables immediate response to emerging problems.
Scroll through captured events to examine specific occurrences. Click any row to select an event and view its complete details. Double-click events to open detailed property dialogs showing all column values. Use the scroll lock feature to prevent automatic scrolling while reviewing historical events.
5.3 Managing Multiple Concurrent Traces
Running multiple traces simultaneously provides flexibility for complex monitoring scenarios. Create separate traces for different aspects of database activity, such as one trace for performance monitoring and another for security auditing. Each trace runs independently with its own configuration.

Resource allocation becomes critical with multiple traces. Each active trace consumes memory, CPU, and potentially disk I/O. Limit the number of concurrent traces and ensure each trace uses appropriate filters to minimize overhead. Monitor server performance while running multiple traces.
Coordinate trace timing to prevent overlapping high-overhead traces. If possible, run resource-intensive traces during low-activity periods. Schedule different traces at different times rather than running everything simultaneously.
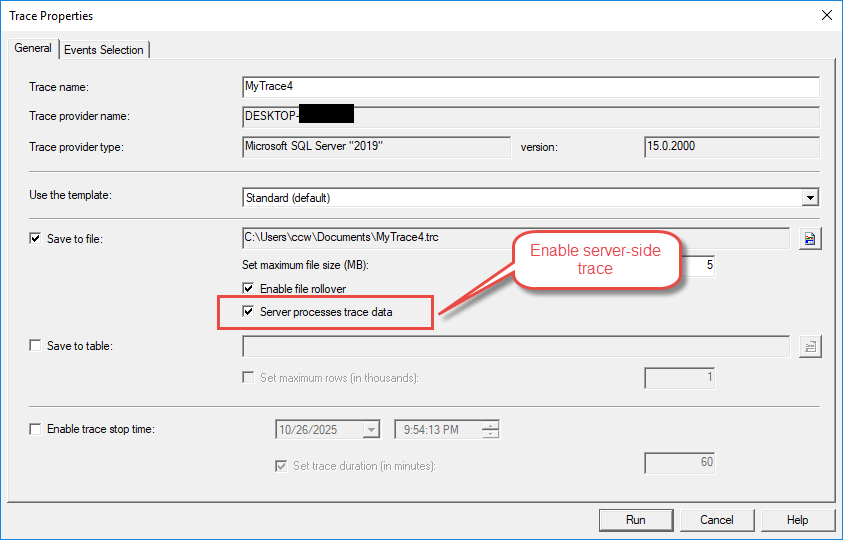
5.4 Client-Side Traces vs. Server-Side Traces
By default, a new created trace is a client-side trace, which requires an active connection from SQL Server Profiler to the database server. The trace stops immediately if the connection is lost or Profiler is closed.
You can also create a server-side trace, which runs entirely on the SQL Server instance without requiring an active Profiler connection. Server-side trace continues running even after closing SQL Server Profiler, writing data to the specified file location.
To create a server-side trace:
- Click File -> New Trace …
- In the Trace Properties dialog, check Save to file
- Set the file location and other settings.
- Enable Server processes trace data to create a server-side trace.
Performance implications differ significantly between trace types. Client-side traces must transmit data over the network to the Profiler interface, adding latency and bandwidth consumption. Server-side traces introduce less overhead because data is written directly to disk on the server.
Use client-side traces for ad-hoc troubleshooting, quick diagnostic sessions, and situations where immediate visual feedback is valuable. Choose server-side traces for production monitoring, long-running captures, and scenarios requiring unattended operation.
6. Analyzing SQL Server Profiler Data
6.1 Opening and Reviewing Saved Traces
Load saved trace files using these steps:
- Launch SQL Server Profiler.
- Click File -> Open -> Trace File.
- Navigate to the trace file location.
- Select the .trc file and click Open.
- The trace data loads into the main window.
Load trace tables following this process:
- Click File -> Open -> Trace Table.
- Connect to the server hosting the trace table.
- Select the database from the Database dropdown.
- Choose the table from the Table dropdown.
- Click OK to load the data.
6.2 Filtering and Searching Trace Data
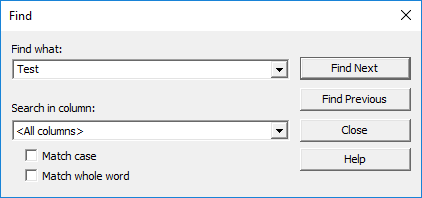
6.2.1 Post-Capture Filtering
Apply filters to loaded trace data using these steps:
- Click Edit -> Find or press Ctrl+F.
- Enter search text in the Find what field.
- Select the column to search from the Look in dropdown.
- Click Find Next to locate matching events.
Column-based filtering refines displayed data without recapturing events. Right-click any column header and select filter options from the context menu. Enter filter criteria to show only matching rows. This approach speeds analysis by hiding irrelevant events.
6.2.2 Finding Specific Events
Search functionality helps locate specific events in large trace files. Use the Find dialog to search by text content, event type, or column value. Regular expressions enable complex search patterns when needed.
Bookmark important events for quick reference during analysis. Right-click interesting events and select bookmark options to mark them. Navigate between bookmarks using keyboard shortcuts or menu commands, facilitating comparison of related events.
6.3 Grouping and Aggregating Events
Group events by column values to identify patterns and summarize activity. Right-click any column header and select Group by this column to organize events. Grouped views collapse similar events together, making it easier to see overall patterns.
Aggregated views provide statistical summaries of trace data. Group by TextData to see how many times each query executed. Group by LoginName to see per-user activity summaries. Aggregation reveals patterns not immediately obvious in detailed event lists.
Expand and collapse groups to drill into specific categories. Click the plus and minus icons beside group headers to show or hide grouped events. This hierarchical view facilitates top-down analysis, starting with high-level patterns and diving into details.
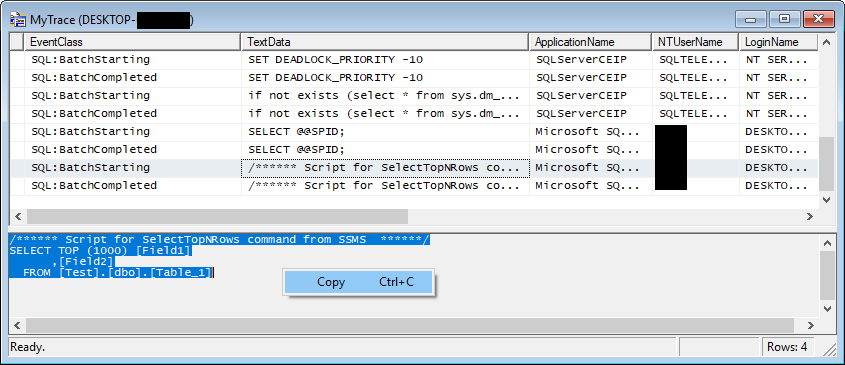
6.4 Extracting SQL Queries from Traces
Extract queries from trace data following these steps:
- Locate the query of interest in the trace grid.
- Click the row to select the event.
- View the complete query text in the bottom panel.
- Press Ctrl+A to select all query text.
- Press Ctrl+C to copy the query text.
- Paste the query into Management Studio for further analysis.
Identify problematic queries by sorting on performance columns. Click the Duration column header to sort by execution time. The slowest queries appear at the top or bottom depending on sort direction. Similarly, sort by CPU, Reads, or Writes to identify resource-intensive operations.
Export queries for testing by copying them from the trace to query windows. Modify extracted queries to test optimization strategies. Compare execution plans and performance metrics between original and optimized versions.
6.5 Correlating Events and Understanding Execution Flow
Parent-child event relationships show execution hierarchies. SQL:BatchStarting events parent SQL:StmtStarting events, which in turn parent procedure execution events. Understanding these relationships helps trace complete execution paths through your code.
Transaction tracking connects related events across time. Use SPID column to group events by session. Within a session, events occur in chronological order, showing the sequence of operations. This view reveals how different operations interact within transactions.
Correlate events by examining shared column values. Events with identical SPID occurred in the same session. Events with the same ApplicationName came from the same application. Use these correlations to understand complex execution scenarios.
7. Common SQL Server Profiler Use Cases
7.1 Performance Troubleshooting
7.1.1 Identifying Slow Queries
Capture slow queries using the following configuration:
- Create a new trace using the TSQL template.
- In the Events Selection tab, verify SQL:BatchCompleted and RPC:Completed are selected.
- Click Column Filters.
- Select Duration from the column list.
- Enter 1000000 in the Greater than or equal field to capture queries taking more than 1 second.
- Click OK and start the trace.
- Run the trace during peak usage periods.
- Stop the trace and sort by Duration to identify the slowest queries.
Duration-based analysis reveals execution time patterns. Sort captured events by Duration column to see longest-running operations first. Examine the TextData column for these events to identify the actual queries responsible for delays.
CPU and I/O intensive queries require different optimization approaches. Sort by CPU column to find processor-bound queries that need algorithmic improvements. Sort by Reads or Writes columns to identify I/O-bound queries that benefit from indexing or query rewriting.
7.1.2 Detecting Blocking and Deadlocks
Configure blocking detection following these steps:
- Create a new trace.
- In the Events Selection tab, expand Locks.
- Select Lock:Deadlock and Lock:Deadlock Chain.
- Expand Errors and Warnings.
- Select Blocked process report.
- Include columns: SPID, TextData, DatabaseName, LoginName.
- Start the trace and monitor for lock events.
Lock event monitoring reveals concurrency issues affecting application performance. Lock:Deadlock events indicate when SQL Server detected and resolved deadlock situations. Lock:Deadlock Chain events show the processes involved in deadlocks.
Deadlock graphs provide visual representations of deadlock scenarios. When a deadlock event occurs, the TextData column contains XML describing the deadlock. Copy this XML and open it in SQL Server Management Studio to view the graphical deadlock diagram showing which processes blocked each other.
7.1.3 Finding Missing Indexes
Capture workload for index analysis using these steps:
- Create a new trace using the Tuning template.
- Configure the trace to save to a file.
- Run the trace during representative workload periods.
- Collect at least several hours of activity.
- Stop the trace and save the file.
- Launch Database Engine Tuning Advisor.
- Select the trace file as the workload source.
- Run the analysis to receive index recommendations.
Integration with Database Engine Tuning Advisor automates index recommendation. The Tuning Advisor analyzes captured workload and suggests indexes that would improve performance. Review recommendations carefully before implementation, considering storage overhead and maintenance costs.
7.2 Application Troubleshooting
7.2.1 Debugging Application Errors
Track application errors using this configuration:
- Create a new trace.
- Expand Errors and Warnings in the Events Selection tab.
- Select Exception, User Error Message, and Attention.
- Include columns: Error, TextData, ApplicationName, SPID.
- Filter by ApplicationName to focus on your application.
- Start the trace and reproduce the error scenario.
- Review captured error events for diagnostic information.
Error tracking reveals exception details often hidden from applications. The Error column contains SQL Server error numbers. The TextData column shows error messages and the query that caused the error. Severity column indicates error severity levels.
Exception monitoring captures runtime problems including constraint violations, permission errors, and timeout events. Correlate error events with preceding query events to understand what triggered the exceptions.
7.2.2 Tracing Application-to-Database Communication
Monitor application activity following these steps:
- Create a new trace using the Standard template.
- Click Column Filters.
- Select ApplicationName and enter your application name in the Like field.
- Optionally filter by HostName to isolate specific servers.
- Start the trace during application operations.
- Review captured events to see all database interactions.
Application name filtering isolates queries from specific applications. SQL Server sets the application name from connection strings, making it easy to trace individual applications in multi-application environments. Verify your connection string includes Application Name parameter for effective filtering.
Connection tracking shows session lifecycle including login, query execution, and logout events. Monitor connection creation rates to identify connection pooling issues. Excessive connection churn indicates potential application configuration problems.
7.2.3 Validating Application Behavior
Verify expected application behavior using trace analysis. Capture all database operations during a business transaction and verify the correct queries execute in the proper sequence. Compare actual captured queries against expected behavior to identify discrepancies.
Parameter validation ensures applications pass correct values to stored procedures and parameterized queries. Examine captured query text to verify parameter values match expectations. Incorrect parameters often cause logic errors that manifest as incorrect business results.
7.3 Security Auditing
7.3.1 Monitoring Login Attempts
Configure login monitoring using these steps:
- Create a new trace.
- Expand Security Audit in the Events Selection tab.
- Select Audit Login, Audit Logout, and Audit Login Failed.
- Include columns: LoginName, HostName, ApplicationName, StartTime.
- Start the trace to monitor authentication activity.
- Review failed login events for potential security issues.
Successful and failed logins provide comprehensive authentication tracking. Audit Login events record successful authentication attempts with user identity and source information. Audit Login Failed events indicate unsuccessful login attempts that may represent attacks or configuration problems.
Authentication tracking reveals patterns in database access. Monitor login frequency to detect unusual activity. Multiple failed login attempts followed by a successful login might indicate compromised credentials. Failed logins from unexpected locations warrant investigation.
7.3.2 Tracking Data Access and Modifications
Monitor data access using this configuration:
- Create a new trace.
- Expand Security Audit.
- Select Audit Database Object Access.
- Include columns: ObjectName, LoginName, TextData, DatabaseName.
- Filter by ObjectName to monitor specific sensitive tables.
- Start the trace to capture access attempts.
SELECT, INSERT, UPDATE, DELETE tracking provides comprehensive data modification auditing. Capture SQL:BatchCompleted events with appropriate filters to monitor all data access operations. Filter by ObjectName or TextData to focus on sensitive tables.
Sensitive data access requires careful monitoring to ensure compliance with security policies. Create traces specifically for tables containing personal information, financial data, or other confidential information. Review access patterns regularly to identify inappropriate data access.
Detect suspicious activity by analyzing query patterns in captured traces. Look for unusual queries that don’t match normal application behavior. SELECT statements with no WHERE clause retrieving entire tables may indicate data exfiltration attempts.
Privilege escalation attempts appear as permission errors or attempts to execute administrative commands. Monitor for queries trying to access system tables, modify server configuration, or create privileged accounts. Filter for Error events and review the TextData column for suspicious activity.
7.4 Capacity Planning and Workload Analysis
Establish baselines by capturing representative workload during normal operations. Run traces during typical business hours to understand standard activity patterns. Save these traces as performance baselines for future comparison.
Peak usage identification reveals when your system experiences maximum load. Capture traces across different time periods including business hours, batch processing windows, and after-hours activity. Analyze event counts and resource consumption to identify peak periods.
Resource utilization patterns emerge from workload analysis. Group events by time intervals to see activity distribution throughout the day. Calculate aggregate CPU, disk I/O, and duration metrics to quantify resource consumption. Use this data to plan capacity upgrades or identify optimization opportunities.
8. Advanced SQL Server Profiler Techniques
8.1 Creating Server-Side Traces with T-SQL
8.1.1 Using sp_trace_create and Related Procedures
Create server-side traces programmatically using T-SQL stored procedures. This approach enables automated trace creation and management without requiring SQL Server Profiler’s graphical interface.
Define a server-side trace using this example code:
- Declare variables for trace ID and file path.
- Call sp_trace_create to create a new trace.
- Use sp_trace_setevent to add events and columns.
- Optionally use sp_trace_setfilter to configure filters.
- Call sp_trace_setstatus to start the trace.
The sp_trace_create procedure initializes a new trace definition. Specify the output file path, maximum file size, and rollover options. The procedure returns a trace ID used in subsequent procedure calls to configure the trace.
Add events using sp_trace_setevent procedure. Specify the trace ID, event ID, and column ID for each event-column combination you want to capture. Call this procedure multiple times to build complete trace configurations.
Configure filters with sp_trace_setfilter procedure. Specify the trace ID, column ID, logical operator, comparison operator, and filter value. Multiple filter calls combine to create complex filter criteria.
Start the trace by calling sp_trace_setstatus with status value 1. Stop traces by calling the same procedure with status value 0. Delete trace definitions by calling with status value 2.
8.1.2 Advantages of Server-Side Traces
Reduced client overhead makes server-side traces ideal for production monitoring. The database server handles all trace operations without consuming client machine resources. Network bandwidth isn’t consumed transmitting events to a client application.
Automated execution enables unattended trace collection. Server-side traces continue running after creation even if no client connection exists. Schedule trace creation through SQL Server Agent jobs for automated monitoring.
Lower performance impact results from server-side processing. Events write directly to disk without additional serialization or network transmission. Buffer management optimizes disk I/O for better overall performance.
8.2 Trace Replay Functionality
8.2.1 Capturing Traces for Replay
Create replay-ready traces following these steps:
- Create a new trace using the TSQL_Replay template.
- Verify all required events and columns are selected.
- Configure the trace to save to a file.
- Run the trace during the workload period you want to capture.
- Stop the trace and save the file.
Required events and columns ensure complete trace replay. The TSQL_Replay template includes all necessary event types and data columns. Missing required elements prevent successful replay, so always use this template when capturing for replay purposes.
8.2.2 Replaying Traces
Replay captured workloads using these steps:
- In SQL Server Profiler, click File -> Open -> Trace File.
- Select the replay-ready trace file.
- Click Replay -> Start.
- Connect to the target server in the replay dialog.
- Configure replay options including replay order and timing.
- Click OK to begin replay.
- Monitor replay progress in the status window.
Replay configuration options control how SQL Server Profiler reproduces the captured workload. Replay events in the order they were captured to maintain temporal relationships. Configure whether to maintain original timing or replay events as fast as possible.
8.2.3 Use Cases for Trace Replay
Load testing benefits from trace replay by reproducing realistic workloads. Capture production workload traces and replay them against test systems to validate performance under real usage patterns. Adjust concurrency settings to simulate different load levels.
Environment migration validation ensures new systems can handle existing workloads. Capture traces from current production systems and replay them on new hardware or updated SQL Server versions. Compare performance metrics to verify migrations won’t degrade performance.
Testing scenarios include regression testing after code changes, validating optimizer changes across SQL Server versions, and stress testing hardware configurations. Replay provides consistent, repeatable workloads for reliable testing.
8.3 Integrating SQL Profiler with Database Engine Tuning Advisor
Create workload files for Database Engine Tuning Advisor by capturing traces with appropriate events. Use the Tuning template to ensure all necessary information is captured for analysis.
Launch Database Engine Tuning Advisor and select your trace file as the workload source. The advisor analyzes captured queries and recommends indexes, indexed views, or partitioning strategies that would improve performance.
Performance optimization workflow integrates trace capture with tuning analysis. Capture representative workloads during normal operations, analyze with Tuning Advisor, review recommendations, test suggested changes in development, and finally implement approved changes in production.
8.4 Automating Trace Collection
Schedule traces using SQL Server Agent jobs to collect data automatically. Create T-SQL scripts that define server-side traces using sp_trace procedures. Schedule these scripts to run at specific times or intervals.
PowerShell automation enables sophisticated trace management scenarios. Write PowerShell scripts that create traces, monitor their status, and process collected data. Schedule PowerShell scripts through Task Scheduler or SQL Server Agent.
SQL Server Agent jobs provide reliable scheduled execution. Create jobs that start traces at the beginning of monitoring periods and stop traces after data collection completes. Configure job notifications to alert administrators of failures.
8.5 Analyzing Traces Programmatically
Read trace files with T-SQL using the fn_trace_gettable function. This table-valued function parses trace files and returns event data as a result set. Query this data using standard T-SQL to perform custom analysis.
Custom analysis scripts enable automated trace processing. Write queries that calculate aggregate statistics, identify patterns, or flag anomalies. Schedule these scripts to run automatically after trace collection completes.
Generate reports by querying trace data stored in tables. Create views that aggregate events by time period, user, or application. Build reporting solutions that provide regular insights into database activity and performance.
9. SQL Server Profiler Best Practices
9.1 Performance Best Practices
9.1.1 Minimizing Trace Overhead
Select only necessary events to reduce trace overhead. Each additional event type increases the amount of data the trace engine must process. Review your monitoring objectives and include only events directly relevant to those goals.
Use filters effectively to prevent capturing irrelevant data. Filter by DatabaseName to exclude system databases. Filter by Duration to capture only slow queries. Filter by ApplicationName to focus on specific applications. Proper filtering dramatically reduces trace overhead.
Server-side versus client-side considerations affect performance impact. Server-side traces write data directly to disk with minimal overhead. Client-side traces transmit events over the network to the Profiler interface, adding latency and bandwidth consumption. Use server-side traces for production monitoring.
9.1.2 Optimizing Trace Storage
File size management prevents disk space exhaustion. Set maximum file size limits appropriate to available storage. Enable file rollover to create multiple files instead of growing a single file indefinitely. Monitor disk space during trace execution.
Table versus file storage involves different performance tradeoffs. File storage offers better performance during trace execution because it bypasses the storage engine. Table storage enables T-SQL queries against trace data but adds write overhead. Choose storage type based on your analysis requirements.
9.2 Security Best Practices
Permission management controls who can create and run traces. Grant ALTER TRACE permission only to trusted users who need trace capabilities. Members of the sysadmin role have unrestricted trace access. Review and audit trace permissions regularly.
Sensitive data protection requires careful trace configuration. Avoid capturing full query text when working with sensitive data. Consider filtering or encrypting trace output containing confidential information. Store trace files in secure locations with appropriate access controls.
Trace file security prevents unauthorized access to captured data. Set file permissions to restrict access to trace files. Encrypt trace files if they contain sensitive information. Delete trace files after analysis completes to minimize exposure risk.
9.3 Production Environment Considerations
9.3.1 When to Use Profiler in Production
Risk assessment determines when SQL Server Profiler is appropriate for production use. Profiler introduces measurable overhead that increases with trace scope. Evaluate whether the diagnostic value justifies the performance impact before running production traces.
Minimal impact configurations enable safer production tracing. Use highly selective filters to capture only critical events. Set Duration thresholds to ignore fast-executing queries. Limit trace duration to short periods during troubleshooting sessions. Configure server-side traces to reduce client overhead.
9.3.2 Alternatives for Production Monitoring
Extended Events provides lower overhead for production monitoring. This modern technology offers better performance and flexibility than SQL Server Profiler. Migrate monitoring solutions to Extended Events for long-term production use.
Query Store captures query performance data automatically without manual trace configuration. Enable Query Store on production databases to track query execution statistics over time. Query Store provides most performance monitoring capabilities without the overhead of tracing.
Dynamic Management Views offer lightweight monitoring for specific scenarios. DMVs provide current state information without capturing historical events. Query DMVs periodically to monitor server health without the overhead of continuous tracing.
9.4 Trace Management Best Practices
Naming conventions ensure trace files are identifiable and organized. Include date, time, server name, and purpose in trace file names. Use consistent naming patterns across all traces to facilitate management and analysis.
Documentation records trace configuration and purpose. Document what events you captured, why you created the trace, and what you learned from analysis. Maintain a log of traces run against production systems for compliance and troubleshooting purposes.
Retention policies prevent excessive trace file accumulation. Define how long trace files should be retained based on business requirements and storage capacity. Automate deletion of old trace files to free disk space. Archive important traces to long-term storage before deletion.
9.5 Common Mistakes to Avoid
Over-tracing causes excessive performance overhead and generates unmanageable data volumes. Avoid capturing all events without filters. Start with narrow, focused traces and expand scope only when necessary. More data isn’t always better for effective troubleshooting.
Forgetting to stop traces wastes resources and fills disk space. Always stop traces when monitoring is complete. Set trace duration limits or maximum file sizes to prevent runaway traces. Monitor running traces regularly and stop inactive or unnecessary traces.
Ignoring filter optimization leads to poor performance and difficult analysis. Invest time configuring effective filters before starting traces. Test filters in development environments to verify they capture expected data. Review and refine filters based on captured results.
10. Alternatives to SQL Server Profiler in 2025
10.1 Extended Events: The Modern Replacement
10.1.1 What are Extended Events
Extended Events represents SQL Server’s modern event handling architecture. Microsoft designed this system specifically to address SQL Server Profiler’s limitations including performance overhead and configuration flexibility. Extended Events provides comprehensive monitoring capabilities with significantly lower resource consumption.
Architecture and benefits distinguish Extended Events from older tracing technologies. The event engine integrates deeply into SQL Server’s core architecture, capturing events with minimal overhead. Asynchronous event buffering prevents monitoring from blocking database operations. Flexible targeting options enable diverse output configurations.
Performance advantages make Extended Events ideal for production monitoring. Benchmarks show Extended Events introduces 50-90% less overhead than equivalent SQL Server Profiler traces. The architecture scales better with high event volumes and supports more concurrent monitoring sessions.
10.1.2 Migrating from Profiler to Extended Events
Event mapping translates SQL Server Profiler events to Extended Events equivalents. Most Profiler events have corresponding Extended Events counterparts. Microsoft provides documentation mapping common events between the two systems.
Session creation in Extended Events requires learning new syntax and concepts. Define event sessions using T-SQL CREATE EVENT SESSION statements or the Extended Events graphical interface in Management Studio. Sessions specify which events to capture, what data to collect, and where to store results.
10.1.3 Extended Events Tools and Interfaces
The SSMS Extended Events UI provides graphical session management. Access Extended Events through the Management folder in Object Explorer. Create, modify, and monitor event sessions through the interface. View captured data in graphical formats including grids and charts.
T-SQL session management enables programmatic Extended Events control. Write CREATE EVENT SESSION statements to define sessions in code. Use ALTER EVENT SESSION to modify running sessions. Drop sessions with DROP EVENT SESSION. This approach facilitates automated monitoring solutions.
10.2 SQL Server Query Store
Query Store captures query performance data automatically for databases where it’s enabled. This feature tracks query plans, execution statistics, and performance metrics over time without manual trace configuration. Query Store maintains historical data enabling trend analysis and regression detection.
Real-time query performance monitoring through Query Store reveals current system behavior. View recently executed queries, their execution plans, and resource consumption. Identify queries with increasing duration or changing execution plans that may indicate problems.
Historical query analysis enables comparison across time periods. Query Store retains performance data for configurable retention periods. Compare current performance against historical baselines to identify regressions. Analyze performance trends to predict future capacity needs.
Use Query Store when you need automatic, always-on performance monitoring. Enable Query Store on production databases to continuously track query behavior. Query Store complements trace-based troubleshooting by providing historical context for performance issues.
10.3 Dynamic Management Views (DMVs)
Lightweight monitoring through DMVs provides current state information without capturing historical events. DMVs expose internal SQL Server statistics and metadata through queryable views. Query DMVs using standard T-SQL SELECT statements.
Common DMV queries for performance monitoring include sys.dm_exec_query_stats for query performance statistics, sys.dm_exec_requests for currently executing requests, and sys.dm_os_wait_stats for wait statistics. These views provide point-in-time insights into server health and activity.
DMVs complement trace-based monitoring by providing real-time metrics. Use DMVs for quick health checks and current state analysis. Combine DMV queries with trace data for comprehensive troubleshooting approaches.
10.4 Third-Party Monitoring Tools
Commercial alternatives offer enhanced monitoring capabilities beyond SQL Server’s built-in tools. Products from vendors like SolarWinds, Redgate, and Quest provide comprehensive monitoring, alerting, and analysis features. These tools often combine multiple data sources including traces, DMVs, and performance counters.
Feature comparison reveals strengths of different monitoring approaches. Third-party tools provide superior user interfaces, automated alerting, and historical trending. SQL Server’s built-in tools offer zero additional cost and deeper integration. Evaluate tools based on your specific requirements and budget.
10.5 Choosing the Right Tool for Your Needs
A decision matrix helps select appropriate monitoring tools. For ad-hoc troubleshooting, SQL Server Profiler remains accessible and effective. For production monitoring, Extended Events or Query Store provide better performance. For comprehensive enterprise monitoring, third-party solutions offer the most features.
Tool selection criteria include performance overhead, ease of use, data retention requirements, and budget constraints. Consider your team’s expertise when selecting tools. Familiar tools enable faster troubleshooting even if newer alternatives offer better features.
Combine multiple tools for comprehensive monitoring strategies. Use Query Store for continuous performance tracking, Extended Events for specific issue investigation, and DMVs for real-time health checks. This layered approach provides robust monitoring without excessive overhead.
11. Troubleshooting SQL Server Profiler Issues
11.1 Common Connection Issues
Authentication failures prevent SQL Server Profiler from connecting to target servers. Verify you’re using correct credentials for the authentication method selected. Windows Authentication requires your Windows account has appropriate SQL Server permissions. SQL Server Authentication requires valid SQL login credentials.
Network connectivity problems manifest as timeout errors or connection failures. Verify SQL Server allows remote connections in its configuration. Check firewall settings permit traffic on SQL Server’s port. Test basic connectivity using ping and telnet before troubleshooting Profiler-specific issues.
11.2 Performance Problems with Profiler
Slow trace execution indicates excessive overhead from trace configuration. Review selected events and eliminate unnecessary ones. Add filters to reduce captured event volume. Consider using server-side traces to reduce client-side processing load.
High resource consumption affects both SQL Server and the Profiler client. Monitor server CPU and memory during trace execution. If server resources are constrained, increase filter selectivity or reduce capture duration. Client resource issues require closing other applications or upgrading client hardware.
11.3 Trace File and Table Issues
Corrupted trace files prevent opening in SQL Server Profiler. Corruption typically results from ungraceful trace termination or disk errors. Try opening the file in a text editor to verify it’s not completely corrupted. Sometimes partial data can be recovered by importing into a table using fn_trace_gettable.
Table access problems occur when trying to load traces from SQL Server tables. Verify you have SELECT permission on the trace table. Check the table hasn’t been dropped or renamed. Ensure you’re connecting to the correct server and database containing the trace table.
11.4 Missing Events or Incomplete Data
Filter misconfiguration causes traces to miss expected events. Review filter criteria carefully to ensure they don’t exclude desired events. Test filters by running short traces and verifying captured data matches expectations. Remove filters temporarily to determine if they’re causing the problem.
Buffer overflow occurs when SQL Server can’t write trace data fast enough to keep up with event generation. This typically happens with unfiltered traces during high activity. Symptoms include missing events or “Events were not captured” warnings. Resolve by adding filters to reduce event volume or increasing trace file location disk I/O performance.
11.5 Profiler Crashes and Errors
Common error messages include “Unable to create trace” indicating permission problems or resource constraints. “Trace was stopped” messages suggest server-side trace failures possibly from disk full conditions. “Invalid trace definition” errors indicate configuration problems.
Resolution strategies depend on the specific error. Permission errors require granting ALTER TRACE permission to the user. Resource errors need freed disk space or memory. Configuration errors require reviewing and correcting trace settings. Restart SQL Server Profiler if it becomes unresponsive.
12. Practical SQL Server Profiler Scenarios and Examples
12.1 Scenario 1: Identifying the Slowest Queries in Your Database
This walkthrough demonstrates capturing and analyzing slow queries.
Configure the trace following these steps:
- Launch SQL Server Profiler and connect to your target server.
- Click File -> New Trace.
- Enter “Slow Query Analysis” in the Trace name field.
- Select TSQL from the Use the template dropdown.
- Click Events Selection tab.
- Click Column Filters.
- Select Duration and enter 1000000 in Greater than or equal.
- Select DatabaseName and enter your database name in Like.
- Click OK to close filters.
- Enable Save to file and specify a file path.
- Click Run to start capturing.
Run the trace during peak business hours for at least 30 minutes to capture representative workload. Stop the trace after sufficient data collection.
Analyze results following this process:
- Click the Duration column header to sort by execution time.
- Identify the top 10 longest-running queries.
- For each query, examine the TextData column.
- Copy the query text and paste into Management Studio.
- Use Display Estimated Execution Plan to analyze the query.
- Look for table scans, missing indexes, or inefficient joins.
- Review CPU, Reads, and Writes columns for resource consumption patterns.
12.2 Scenario 2: Debugging a Deadlock Issue
This example shows how to capture and analyze deadlocks.
Configure deadlock monitoring using these steps:
- Create a new trace named “Deadlock Investigation”.
- Click Events Selection tab.
- Click Show all events.
- Expand Locks category.
- Select Lock:Deadlock.
- Select Lock:Deadlock Chain.
- Expand Errors and Warnings category.
- Select Blocked process report.
- Ensure TextData column is selected.
- Click Run to start monitoring.
When a deadlock occurs during trace execution, the Lock:Deadlock event appears in the trace grid.
Interpret deadlock information following these steps:
- Click the Lock:Deadlock event row.
- View the TextData column in the bottom panel.
- Copy the XML content from TextData.
- Open Management Studio and create a new query window.
- Paste the XML into the query window.
- Save the file with .xdl extension.
- Open the .xdl file in Management Studio to view the deadlock graph.
- The graph shows processes involved, resources locked, and the victim chosen.
- Review the queries from both processes to understand the conflict.
Resolution steps typically involve reordering operations in application code to access resources in consistent order, reducing transaction scope, or implementing appropriate locking hints.
12.3 Scenario 3: Tracking All Queries from a Specific Application
This scenario demonstrates application-specific query monitoring.
Configure application-specific tracing using these steps:
- Create a new trace named “Application Query Tracking”.
- Select the Standard template.
- Click Events Selection tab.
- Click Column Filters.
- Select ApplicationName.
- Enter your application name in the Like field.
- If your application uses connection pooling, you may need wildcard matching.
- Click OK to apply the filter.
- Enable Save to table for easier querying.
- Click Run to start capturing.
Query pattern analysis reveals how your application interacts with SQL Server:
- After collecting data, stop the trace.
- Open Management Studio and connect to the server with the trace table.
- Query the trace table to analyze patterns.
- Count queries by type to see the operation mix.
- Identify most frequently executed queries.
- Look for queries that could be cached or optimized.
- Check for repeated identical queries indicating missing connection pooling.
12.4 Scenario 4: Auditing Data Access for Compliance
This example shows security audit trail creation.
Configure security auditing following these steps:
- Create a new trace named “Security Audit Trail”.
- Click Events Selection tab.
- Click Show all events.
- Expand Security Audit category.
- Select Audit Login, Audit Logout, Audit Login Failed.
- Select Audit Database Object Access.
- Expand TSQL category.
- Select SQL:BatchCompleted.
- Click Column Filters.
- Filter by ObjectName to monitor specific sensitive tables.
- Enable Save to table for long-term retention.
- Enable server-side trace for unattended operation.
- Click Run to start auditing.
Generate audit reports by querying the trace table:
- Create queries summarizing access by user and time period.
- Identify unusual access patterns or after-hours activity.
- Document failed login attempts for security review.
- Export audit data to reporting systems for compliance documentation.
- Archive completed audit traces according to retention policies.
12.5 Scenario 5: Capturing a Workload for Performance Testing
This scenario demonstrates workload capture for testing purposes.
Create replay-ready traces using these steps:
- Create a new trace named “Workload Capture”.
- Select TSQL_Replay from the template dropdown.
- This template includes all required events and columns for replay.
- Click Events Selection tab.
- Apply filters if you want to capture specific workload segments.
- Enable Save to file.
- Specify a file path with adequate disk space.
- Set appropriate file size limits and enable rollover.
- Click Run to start capturing.
Capture during representative business operations. For comprehensive workload capture, run the trace for several hours covering different activity patterns. Stop the trace after collecting sufficient data.
Workload analysis reveals system behavior patterns:
- Open the captured trace file in SQL Server Profiler.
- Review event distribution by type and time.
- Calculate aggregate resource consumption metrics.
- Identify peak activity periods and resource bottlenecks.
- Use the trace for Database Engine Tuning Advisor analysis.
- Replay the trace against test systems to validate changes.
13. Database Corruption Detection with SQL Server Profiler
13.1 Using SQL Server Profiler for Early Corruption Warning Signs
Database corruption represents one of the most serious threats to data integrity and system reliability. While SQL Server Profiler isn’t a dedicated corruption detection tool, it can capture critical warning signs that indicate potential corruption issues requiring immediate investigation.
13.2 Critical Error Events Indicating Potential Corruption
- Severity 24 Errors(823, 824, 825): Hardware and Media Failures.
- Error 605: Failed Page Retrieval Attempts
- Error 8928 and 8929: Object Corruption
13.3 Suspect Database Behaviors and Warning Patterns
- Repeated Query Timeouts on Specific Objects
- Access Violations and Application Crashes
- Unusual Error Clustering
13.4 Run DBCC CHECKDB Based on Profiler Findings
If SQL Server Profiler finds suspicious corruptions, you can use DBCC CHECKDB to perform a complete check of the database. Then perform a repair if corruptions are confirmed. We have written a comprehensive guide how to do these tasks.
If DBCC CHECKDB fails to repair the database, the corruptions are severe. In such a case, you can resort to a third-party SQL recovery tool.
14. FAQs
Q: Is SQL Server Profiler still supported in SQL Server 2022?
A: Yes, SQL Server Profiler is still included in SQL Server 2022 and SQL Server Management Studio, despite being deprecated since SQL Server 2016. Microsoft continues to ship the tool with current versions, but recommends migrating to Extended Events for new monitoring implementations. The tool remains functional and widely used for troubleshooting and ad-hoc analysis.
Q: What is the difference between SQL Server Profiler and SQL Trace?
A: SQL Server Profiler is the graphical user interface tool that connects to the SQL Trace engine running within SQL Server. SQL Trace is the underlying technology that actually captures events. You can create traces using Profiler’s interface or directly through T-SQL stored procedures like sp_trace_create. Profiler provides easier configuration while T-SQL traces offer more automation possibilities.
Q: How much performance overhead does SQL Server Profiler add?
A: Performance impact varies based on trace configuration. A well-filtered trace capturing only specific events can add 1-5% overhead. Poorly configured traces without filters can add 20-50% or more overhead, especially on busy systems. Server-side traces have lower impact than client-side traces. Always use filters to minimize event volume and test traces in non-production environments first.
Q: Can I run SQL Server Profiler on production servers?
A: You can run SQL Server Profiler on production servers, but exercise caution. Use highly selective filters, limit trace duration, and prefer server-side traces to minimize impact. Run production traces during low-activity periods when possible. For continuous production monitoring, consider Extended Events or Query Store instead, as they offer lower overhead.
Q: What permissions do I need to use SQL Server Profiler?
A: You need ALTER TRACE permission to create and run traces. Members of the sysadmin fixed server role automatically have this permission. For non-sysadmin users, explicitly grant ALTER TRACE permission. Additionally, you need appropriate permissions to save trace data to files or tables based on your configuration.
Q: Why can’t I see all events in my trace?
A: Missing events typically result from overly restrictive filters or buffer overflow. Review your filter configuration to ensure it’s not excluding desired events. Buffer overflow occurs when SQL Server can’t write events fast enough, usually with unfiltered traces on busy systems. Add filters to reduce event volume or increase disk I/O performance. Check for error messages indicating events were not captured.
Q: How do I capture deadlock information with SQL Server Profiler?
A: Create a trace that includes the Lock:Deadlock and Lock:Deadlock Chain events from the Locks category. Ensure the TextData column is selected, as it contains the deadlock graph XML. When a deadlock occurs, copy the XML from the TextData column, save it with a .xdl extension, and open it in SQL Server Management Studio to view the graphical deadlock diagram.
Q: What’s the difference between saving traces to files versus tables?
A: Files offer better performance during trace execution because they bypass the SQL Server storage engine. File traces write data directly to disk with minimal overhead. Table traces write through the storage engine, adding overhead but enabling immediate T-SQL queries against trace data. Use files for performance-sensitive scenarios and tables when you need to query data immediately during or after capture.
Q: Can I automate SQL Server Profiler trace collection?
A: Yes, automate trace collection using server-side traces created with T-SQL stored procedures. Write scripts using sp_trace_create and related procedures, then schedule them through SQL Server Agent jobs. This approach enables unattended trace collection on specified schedules. PowerShell scripts provide another automation option for more complex scenarios.
Q: How long should I run a trace?
A: Trace duration depends on your objectives. For troubleshooting specific issues, run traces while reproducing the problem, typically 5-30 minutes. For performance analysis, capture at least one hour during peak activity periods. For workload analysis or capacity planning, collect several hours across different time periods. Always stop traces when monitoring is complete to free resources.
Q: What should I do if my trace file gets too large?
A: Enable file rollover in trace properties to create multiple smaller files instead of one large file. Set a maximum file size appropriate to your disk space and analysis needs. Use filters to reduce captured event volume. For large traces, consider analyzing data in segments rather than loading the entire trace at once. Archive or delete old trace files regularly to manage disk space.
Q: How do I find the queries causing high CPU usage?
A: Create a trace with SQL:BatchCompleted and RPC:Completed events. Include the CPU, Duration, and TextData columns. Filter by Duration to capture only queries exceeding a threshold like 1000 milliseconds. After collecting data, sort by the CPU column in descending order. The queries at the top consume the most processor time. Examine these queries for optimization opportunities like missing indexes or inefficient logic.
Q: Can SQL Server Profiler capture query execution plans?
A: SQL Server Profiler can capture execution plan information through the Showplan XML events in the Performance category. Select Showplan XML or Showplan XML Statistics Profile events to capture complete execution plans. The TextData column contains the XML plan data. However, for routine execution plan analysis, SQL Server Management Studio’s graphical execution plan features or Query Store provide easier alternatives.
Q: What’s the best template to start with for general monitoring?
A: The Standard template provides a good starting point for general monitoring. It includes common query execution events, stored procedure calls, and error tracking with balanced overhead. For lower-impact monitoring focused on query performance, use the TSQL template. Customize templates based on your specific needs by adding filters and adjusting event selection after understanding the basics.
Q: How do I trace only a specific application or user?
A: Use column filters to isolate specific applications or users. For applications, filter by ApplicationName column using the name specified in your connection string. For users, filter by LoginName column with the SQL Server login or Windows account name. Combine multiple filters to narrow focus further, such as filtering by both ApplicationName and DatabaseName to monitor one application’s activity in a specific database.
15. Conclusion and Next Steps
15.1 Key Takeaways
SQL Server Profiler remains a valuable tool for ad-hoc database troubleshooting despite its deprecated status. The straightforward interface and comprehensive event capture make it ideal for quick diagnostic sessions when you need immediate results. Use Profiler for troubleshooting specific issues, analyzing application behavior, and security auditing.
Best practices include using filters aggressively to minimize performance impact, preferring server-side traces for production environments, and limiting trace duration to necessary periods. Select only essential events and columns to reduce overhead. Save traces to files rather than tables for better performance during capture.
15.2 Moving Forward: Embracing Modern Tools
Transition from SQL Server Profiler to Extended Events for long-term monitoring solutions. While Profiler remains functional, investing time learning Extended Events positions you for future SQL Server versions. Start with simple Extended Events sessions that replicate your common Profiler traces.
Enable Query Store on production databases to gain automatic performance monitoring without manual trace configuration. Query Store captures query plans and execution statistics continuously, providing baseline data for performance analysis. Combine Query Store with targeted Extended Events sessions for comprehensive monitoring.
15.3 Additional Resources
The following resources will help you deepen your SQL Server Profiler knowledge and stay current with monitoring best practices:
Official Microsoft Documentation
- SQL Server Profiler Documentation – Comprehensive reference for events, columns, and procedures
- SQL Trace System Stored Procedures – T-SQL reference for server-side trace creation
- Extended Events Documentation – Migration guidance and modern monitoring approaches
- Query Store Documentation – Automatic query performance tracking reference
- Performance Monitoring and Tuning Tools – Overview of all SQL Server monitoring options
Community Resources
- SQL Server Central – Articles, forums, and scripts for database professionals
- Stack Overflow SQL Server Tag – Community Q&A for specific troubleshooting questions
- Reddit r/SQLServer – Discussion forum for SQL Server topics and advice
- SQLServerCentral.com Forums – Active community discussions on profiling and performance
- MSDN SQL Server Forums – Microsoft-hosted community support forums
Blogs and Technical Articles
- SQL Server Performance Monitor – Dedicated performance monitoring and optimization content
- Brent Ozar Unlimited Blog – Performance tuning and monitoring best practices
- SQLSkills.com – Expert-level SQL Server content from industry leaders
- Microsoft SQL Server Blog – Official product updates and feature announcements
- Simple Talk – Practical SQL Server tutorials and case studies
Training and Certification
- Microsoft Learn – Free online training modules for SQL Server
- Microsoft Certified: Azure Database Administrator Associate – Official certification path
- Pluralsight SQL Server Courses – Video training on profiling and performance tuning
- LinkedIn Learning SQL Server Training – Professional development courses
- Udemy SQL Server Performance Courses – Practical hands-on training options
Books
- SQL Server Query Performance Tuning – Comprehensive performance optimization guide
- Pro SQL Server Internals – Deep dive into SQL Server architecture
- SQL Server Execution Plans – Understanding query optimization
- Expert Performance Indexing for SQL Server – Index design and optimization
- SQL Server Advanced Troubleshooting and Performance Tuning – Advanced diagnostic techniques
Tools and Utilities
- SQL Server Management Studio – Primary interface for SQL Server Profiler
- Azure Data Studio – Modern cross-platform database tool
- sp_WhoIsActive – Popular community-created monitoring stored procedure
- SQL Sentry Plan Explorer – Free execution plan analysis tool
- DBForge Studio – Third-party SQL Server development and administration tool
About the Author
Yuan Sheng is a senior database administrator (DBA) with over 10 years of experience in SQL Server environments and enterprise database management. He has successfully resolved hundreds of database recovery scenarios across financial services, healthcare, and manufacturing organizations.
Yuan specializes in SQL Server database recovery, high availability solutions, and performance optimization. His extensive hands-on experience includes managing multi-terabyte databases, implementing Always On Availability Groups, and developing automated backup and recovery strategies for mission-critical business systems.
Through his technical expertise and practical approach, Yuan focuses on creating comprehensive guides that help database administrators and IT professionals solve complex SQL Server challenges efficiently. He stays current with the latest SQL Server releases and Microsoft’s evolving database technologies, regularly testing recovery scenarios to ensure his recommendations reflect real-world best practices.
Have questions about SQL Server recovery or need additional database troubleshooting guidance? Yuan welcomes feedback and suggestions for improving these technical resources.