1. Introduction to SQL Server Performance Monitor
1.1 What is SQL Server Performance Monitor?
SQL Server performance monitor is the process of tracking, analyzing, and managing the performance and health of your SQL Server databases. It involves collecting and interpreting data about various aspects of your database system to ensure optimal performance, prevent issues, and maintain database health.
Performance monitoring encompasses tracking query execution times, resource utilization, index performance, blocking and deadlocks, and database growth patterns. This continuous oversight helps administrators identify potential problems before they impact users or business operations.
1.2 Key Benefits of Performance Monitoring
Effective SQL Server performance monitor delivers several critical advantages:
- Proactive issue detection: Identify and address potential problems before they impact users or business operations
- Performance optimization: Pinpoint bottlenecks and inefficiencies to improve overall database performance
- Capacity planning: Forecast resource needs and plan for future growth based on historical data
- Compliance and security: Ensure adherence to regulatory requirements and detect suspicious activities
1.3 Common Performance Challenges
Without proper SQL database performance monitor, organizations face several risks:
- Unexpected downtime that disrupts business operations
- Poor application performance affecting user experience
- Data loss or corruption
- Inefficient resource utilization leading to unnecessary costs
- Frustrated users and potential revenue loss
According to a 2023 IDC study, 65% of database performance issues stem from poor monitoring or optimization practices.
2. Understanding Windows Performance Monitor (PerfMon)
2.1 What is Windows Performance Monitor?
Windows Performance Monitor (PerfMon) is a built-in Windows tool that monitors system resources and application performance. For SQL Server administrators, PerfMon provides invaluable insights into both operating system and SQL Server metrics, making it essential for comprehensive performance analysis.
PerfMon measures performance statistics at regular intervals and saves those stats in files for later analysis. Database administrators can select the time interval, file format, and which statistics to monitor. The tool isn’t SQL Server-specific—system administrators use it to monitor Windows itself, Exchange, file servers, and any application that can experience bottlenecks.
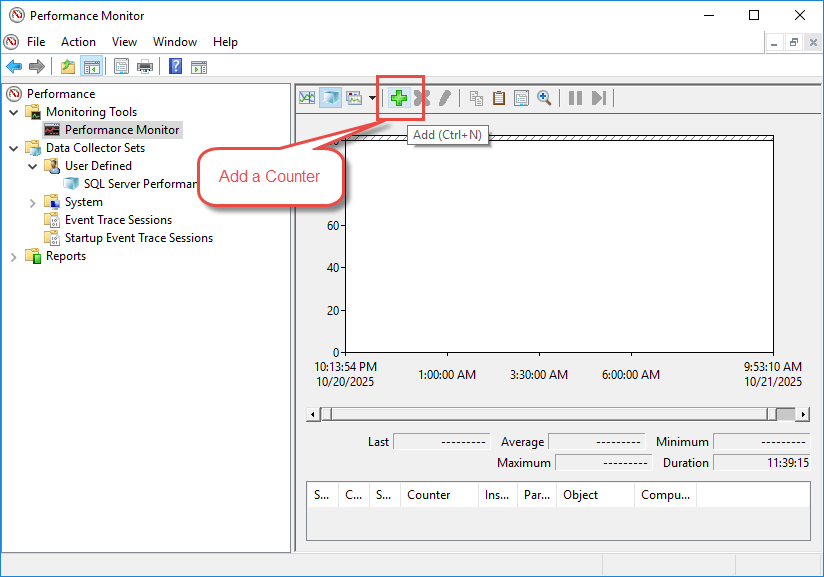
2.2 Launching Performance Monitor
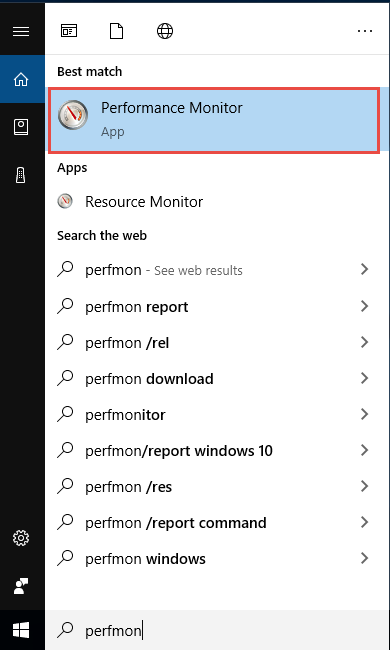
You can launch Performance Monitor using several methods:
- Click Start, type perfmon in the search box, click the “Performand Monitor” in the search result:

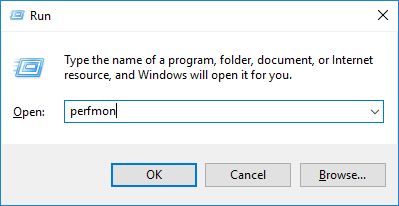
- Press Windows + R, type perfmon, and press Enter

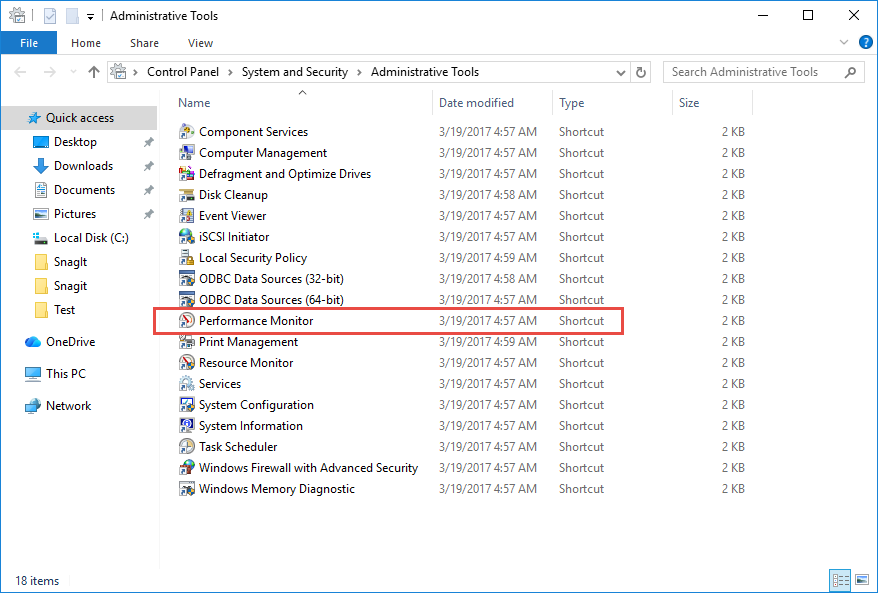
- Navigate to Control Panel -> System and Security -> Administrative Tools -> Performance Monitor

3. Essential SQL Server Performance Counters
3.1 Memory Performance Counters
Memory counters are critical for monitoring SQL Server performance as they indicate whether your database has sufficient memory resources.
Available MBytes
This counter shows the amount of physical memory immediately available for allocation. It should remain fairly constant and ideally not drop below 4096 MB. Low values may indicate that SQL Server’s max memory setting is left at default, or non-SQL Server applications are consuming memory.
Page Life Expectancy
Page Life Expectancy measures how long (in seconds) a page stays in the buffer pool without being referenced. A normal value is 300 seconds or more. Lower values indicate memory pressure and excessive buffer turnover, reducing cache effectiveness.
Buffer Cache Hit Ratio
This counter indicates the percentage of data requests answered using the SQL buffer cache (memory) rather than reading from disk. It commonly meets or exceeds 99%. Lower values suggest that SQL Server needs more memory or is still warming up after a restart.
Memory Grants Pending
This shows the number of processes waiting for memory within SQL Server. Under normal conditions, this value should consistently be 0. Higher values indicate insufficient memory allocation to SQL Server.
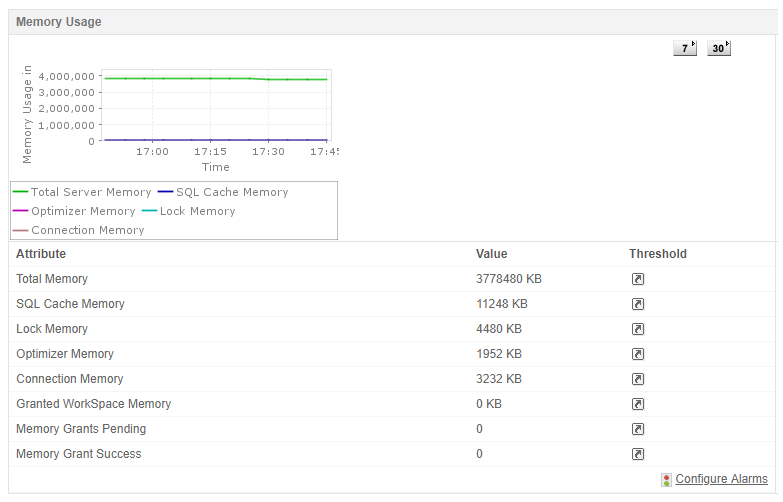
Target Server Memory vs Total Server Memory
Target Server Memory indicates the ideal amount of memory SQL Server wants to use. Total Server Memory shows what SQL Server currently uses. The ratio between these values should be approximately 1. Significant differences may indicate memory pressure or insufficient available memory.
3.2 Processor Performance Counters
CPU counters help identify processor bottlenecks and understand how SQL Server utilizes computing resources.
% Processor Time
This measures the percentage of elapsed time the processor spends executing non-idle threads. On active servers, values can spike to 100%, but sustained usage over 70-75% typically indicates performance issues for users. Missing or inadequate indexes often cause high CPU usage.
% Privileged Time
Processor time splits into User mode and Privileged (Kernel) mode processing. All disk access and I/O occurs under Kernel mode. If this counter exceeds 25%, the system likely performs too much I/O. Normal values range between 5% and 10%.
Processor Queue Length
This counter shows threads waiting for CPU resources. Values consistently above 1 (except during SQL Server backup compression) indicate CPU pressure. This often means other applications are installed on the SQL Server machine, which violates best practices.
Context Switches/sec
This measures how frequently the processor switches between threads. Excessive context switching can impact performance and indicates high system load.
3.3 Disk I/O Performance Counters
Disk counters are essential for SQL performance monitoring as disk I/O often becomes the primary bottleneck in database systems.
% Disk Time
This records the percentage of time the disk was busy with read/write operations. Values consistently above 85% indicate an I/O bottleneck. Since disk is much slower than memory, reducing this metric improves performance.
Avg. Disk sec/Read and Avg. Disk sec/Write
These counters measure average time (in seconds) for read and write operations. If average values exceed 10-20ms, the disk takes too long to process data. Transaction log drives require especially fast write performance.
Disk Queue Length
This shows outstanding requests to read/write to disk. Values consistently higher than 2 (or 2 per disk for RAID arrays) indicate the disk cannot keep up with I/O requests.
Disk Bytes/sec
This monitors the rate of data transfer to/from disk. If this exceeds the disk’s rated capacity, data begins to backlog, as indicated by increasing Disk Queue Length.
Disk Transfers/sec
This tracks the number of read/write operations performed on the disk. SQL Server data access is typically random, which is slower due to drive head movement. Ensure this value stays below your disk drive’s maximum rating (typically 100/sec for standard drives).
3.4 SQL Server Specific Counters
3.4.1 Buffer Manager Counters
Buffer Manager counters monitor SQL Server’s memory buffer operations:
- Page reads/sec: Cumulative count of physical database page reads
- Page writes/sec: Cumulative count of physical database page writes
- Lazy writes/sec: Number of buffers written by lazy writer to free memory
- Checkpoint pages/sec: Pages flushed by checkpoint or other operations requiring all dirty pages to be flushed
3.4.2 SQL Statistics Counters
These counters provide insight into SQL Server query processing:
- Batch Requests/sec: Number of SQL batch requests received by server. This serves as a benchmark for server activity
- SQL Compilations/sec: Number of SQL compilations. Should be 10% or less of total Batch Requests/sec
- SQL Re-Compilations/sec: Number of SQL re-compilations. Should also be 10% or less of total Batch Requests/sec
3.4.3 General Statistics Counters
- User Connections: Number of users connected to the system. Used as a benchmark to track connection growth over time
- Processes Blocked: Current count of blocked processes. Ideally should be 0
3.4.4 Memory Manager Counters
- Memory Grants Pending: Total number of processes waiting for workspace memory grant. Should ideally be 0
4. Setting Up Performance Monitor for SQL Server(Windows Vista / Server 2008 and later)
First of all, we need to create a container to manage counters more easily:
- For Windows Vista / Server 2008 and later versions, you can create Data Collector Sets in this section.
- For Windows XP / Server 2003 and earlier versions, you can create Counter Logs in the next section.
4.1 What are Data Collector Sets?
Data Collector Sets organize performance counters, event trace data, and system configuration information into a single collection unit. They provide more flexibility than simple counter logs and enable automated, scheduled data collection for comprehensive SQL database performance monitoring.
4.2 Creating a Data Collector Set
Create a custom Data Collector Set to monitor SQL Server performance counters:
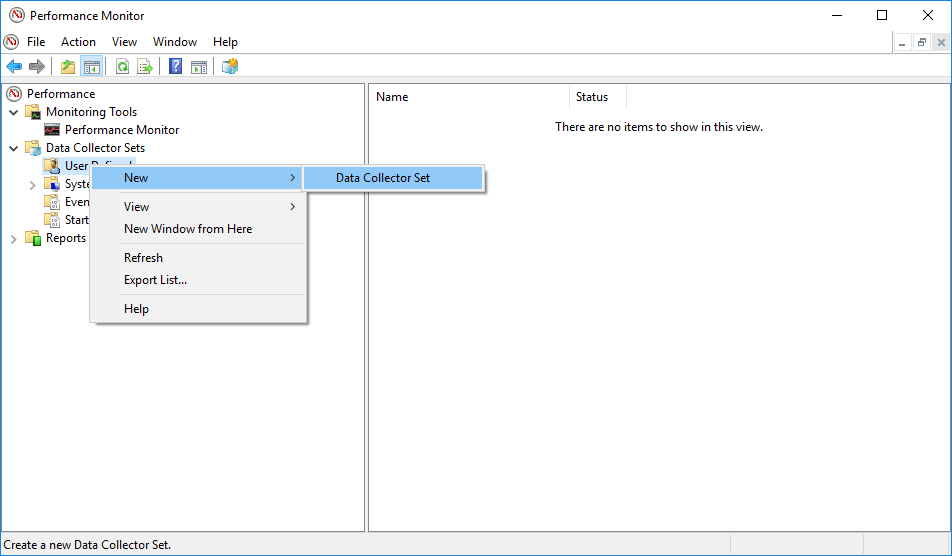
- Open Performance Monitor
- Expand Data Collector Sets
- Right-click User Defined
- Select New -> Data Collector Set

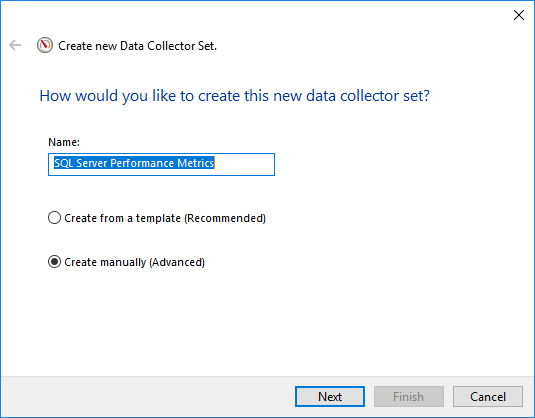
- Enter a descriptive name (e.g., “SQL Server Performance Metrics”)
- Select Create manually (Advanced)

- Click Next
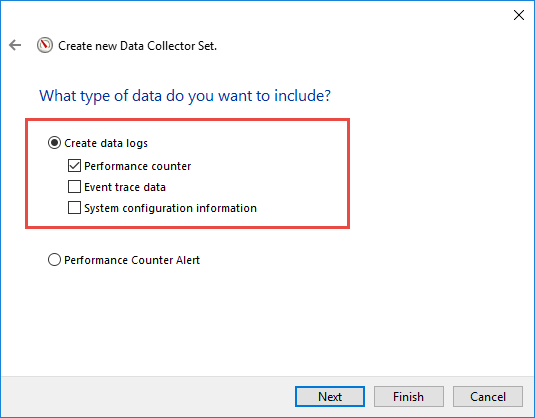
- Check Create data logs -> Performance Counter
- Click Next
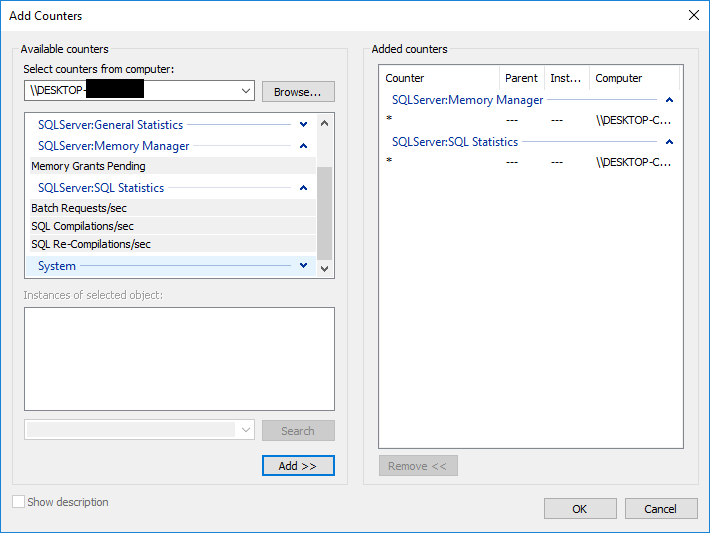
- Click Add to select counters
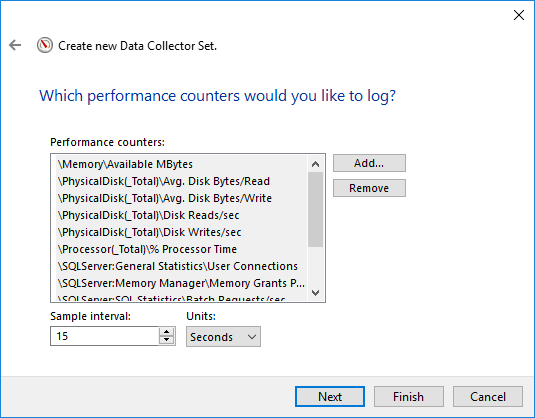
- Add desired SQL Server and system counters.

- Set Sample interval
- For routine monitoring, use 1 minute (60 seconds)
- For active troubleshooting, use 15-30 seconds
- Avoid running high-frequency captures long-term, as they can impact performance and generate excessive data.
- Click Next
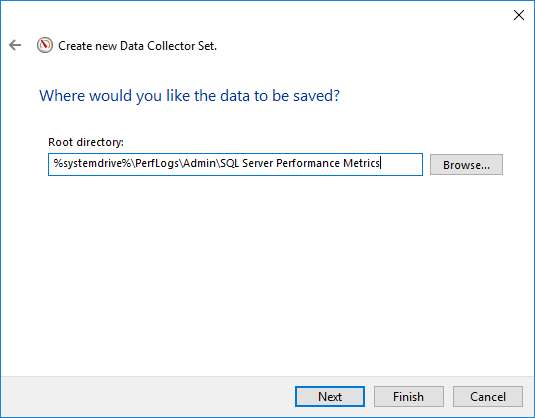
- Choose the location to save the logs
- Click Finish, a new Data Collector Set will be created.
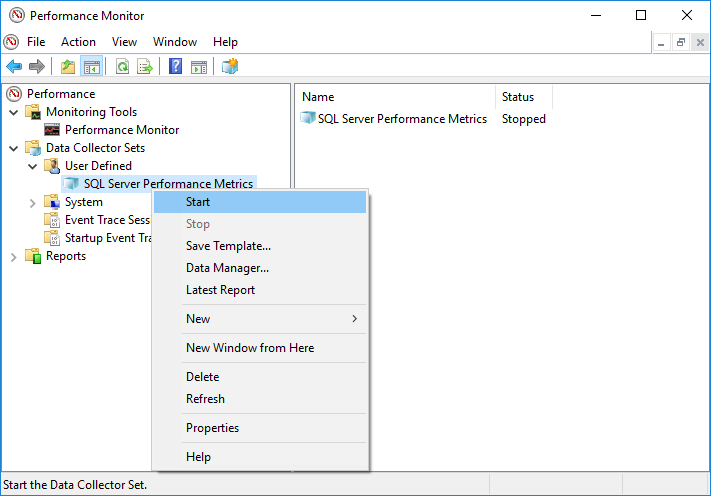
- By default, the new Data Collector Set will NOT be started automatically. You need find it in the left panel, under Performance -> Data Collector Sets -> User Defined -> Your Data Collector, right-click it and choose Start

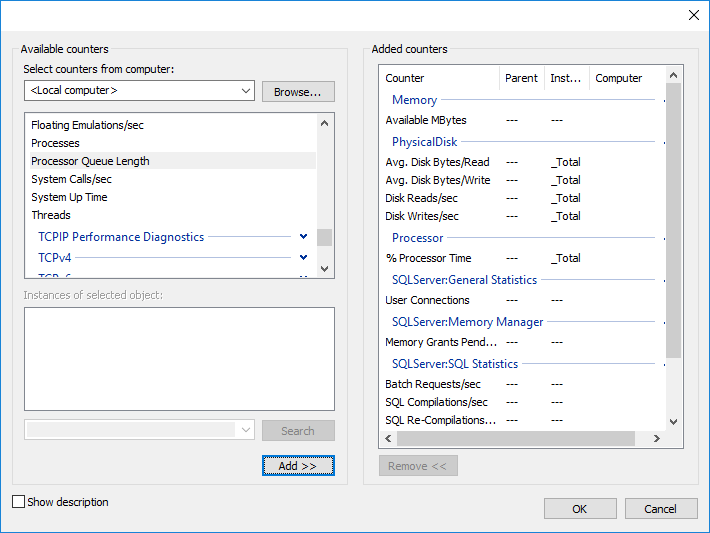
4.3 Key Counters to Add
- Memory -> Available MBytes
- Physical Disk -> Avg. Disk sec/Read (all instances except _Total)
- Physical Disk -> Avg. Disk sec/Write (all instances except _Total)
- Physical Disk -> Disk Reads/sec (all instances except _Total)
- Physical Disk -> Disk Writes/sec (all instances except _Total)
- Processor -> % Processor Time (all instances except _Total)
- SQLServer: General Statistics -> User Connections
- SQLServer: Memory Manager -> Memory Grants Pending
- SQLServer: SQL Statistics -> Batch Requests/sec
- SQLServer: SQL Statistics -> SQL Compilations/sec
- SQLServer: SQL Statistics -> SQL Recompilations/sec
- System -> Processor Queue Length
4.4 Setting Stop Conditions
Configure stop conditions to prevent unlimited data growth:
- After creating the Data Collector Set, right-click it and select Properties
- Click the Stop Condition tab
- Enable Overall duration
- Set duration to 1 day (24 hours)
- Click OK to save
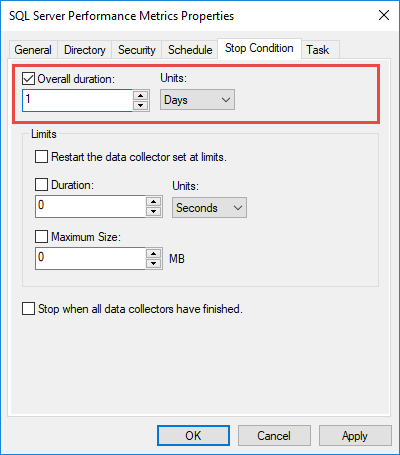
This ensures the log doesn’t grow too large and automatically restarts if scheduled.
4.5 Scheduling Data Collection
Automate data collection to ensure consistent monitoring:
- Right-click your Data Collector Set and select Properties
- Click the Schedule tab
- Click Add to create a new schedule
- Configure start date and time
- Set recurrence pattern (e.g., daily)
- Click OK to save the schedule
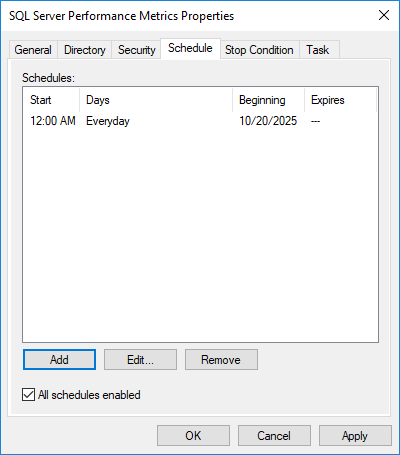
For automatic startup, configure the Data Collector Set to start when the server boots by creating a startup trigger in Windows Task Scheduler.
5. Setting Up Performance Monitor for SQL Server(Windows XP / Server 2003 and earlier)
For Windows XP / Server 2003 and earlier versions, you can create Counter Logs, which let you select a set of performance counters and log them to a file periodically.
5.1 Creating Counter Logs
Follow these steps to create a new counter log:
- Open Performance Monitor
- Expand Performance Logs and Alerts in the left pane
- Right-click Counter Logs
- Select New Log Settings
- Name the log with your database server name (e.g., “ProductionSQL01”)
- Click OK to begin configuration
Creating separate counter logs for each server allows you to test performance on individual servers without collecting data for all servers simultaneously.
5.2 Adding Performance Counters
After creating a counter log, add the specific performance counters you want to monitor:
- Click the Add Counters button
- Change the computer name to point to your SQL Server instance
- Press Tab to load available performance objects
- Select a performance object from the dropdown (e.g., Memory)
- Choose specific counters from the list
- Select instances if applicable (e.g., individual processors or disks)
- Click Add to include the counter
- Repeat for all desired counters
- Click Close when finished
5.3 Configuring Sample Intervals
The sample interval determines how frequently Performance Monitor collects data. Configure appropriate intervals based on your monitoring needs:
- In the counter log properties, locate Sample data every
- Set the interval (default is 15 seconds)
- For baseline monitoring, use 1 minute intervals for daily collection
- For troubleshooting, use 15-30 second intervals for short bursts
- Click OK to apply
Remember that smaller intervals generate more data, which can be harder to render and analyze. Larger intervals may miss important spikes. Balance data granularity with storage and analysis requirements.
5.4 Configuring Log Files
Proper log file configuration ensures data is stored efficiently and accessibly:
- Click the Log Files tab in counter log properties
- Change log file type to Text File (Comma delimited) for easy Excel import
- Click Configure
- Set the file path to a dedicated location (e.g., a shared PerformanceLogs folder)
- Click OK to confirm
Use a network-accessible share for log storage so you can access files remotely and share them with other users.
5.5 Setting Up Credentials
Configure appropriate credentials so Performance Monitor can access remote SQL Server instances:
- In the counter log properties, locate Run As
- Enter your domain username in the format: DOMAIN\username
- Click Set Password
- Enter and confirm your password
- Click OK to save
This allows the PerfMon service to gather statistics using your domain permissions rather than its own credentials.
6. Analyzing Performance Monitor Data
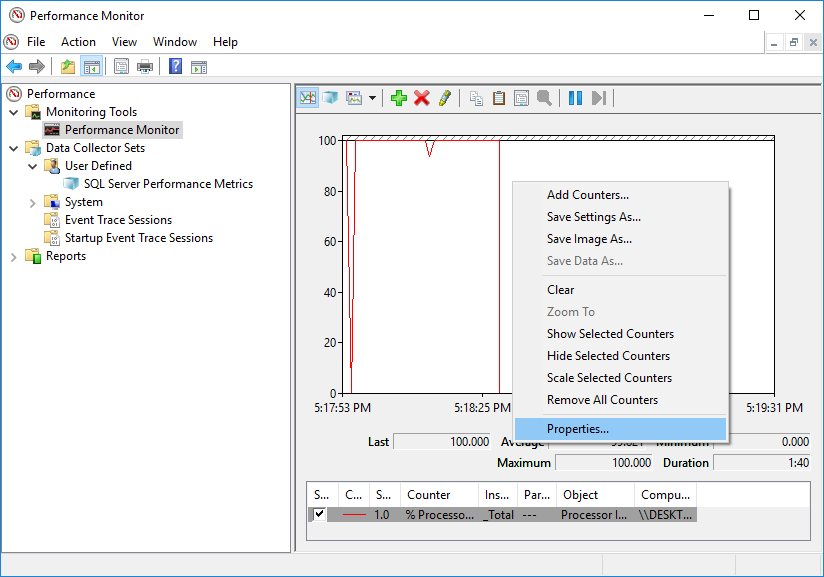
6.1 Viewing Log Files in Performance Monitor
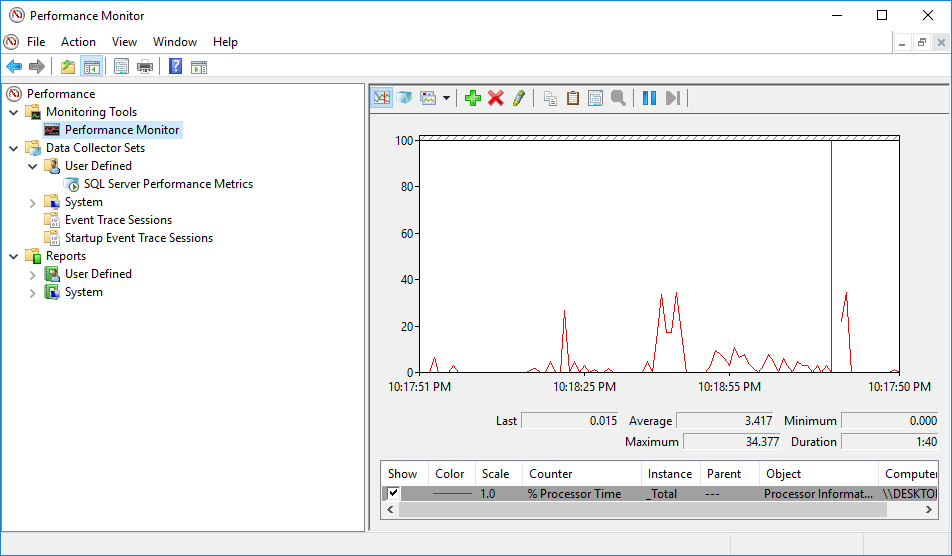
Performance Monitor can display historical data from saved log files:
- Open Performance Monitor
- In the left pane, click Monitoring Tools -> Performance Monitor.
- Right-click anywhere in the graph area
- Select Properties

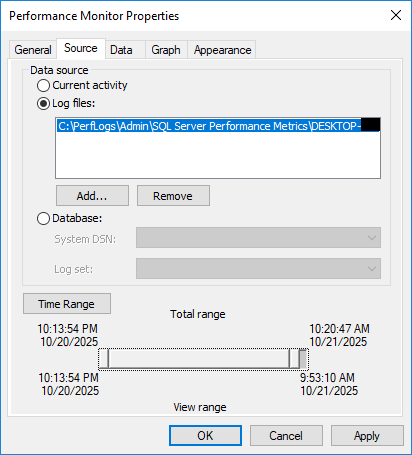
- Click the Source tab
- Select Log files radio button
- Click Add
- Navigate to your log file (.blg or .csv)
- Select the file and click Open

- Use the Time Range slider to select the period you want to analyze
- Click OK to close the Properties dialog
- Click the green plus icon to add counters from the log file
- Select desired counters to display
- Click OK
The graph will now display historical data from the log file. Use the Time Range slider in Properties to narrow down specific time periods for detailed analysis.
6.2 Exporting Data to Excel
Excel provides powerful analysis capabilities for performance counter data:
- Open Performance Monitor with your log file loaded
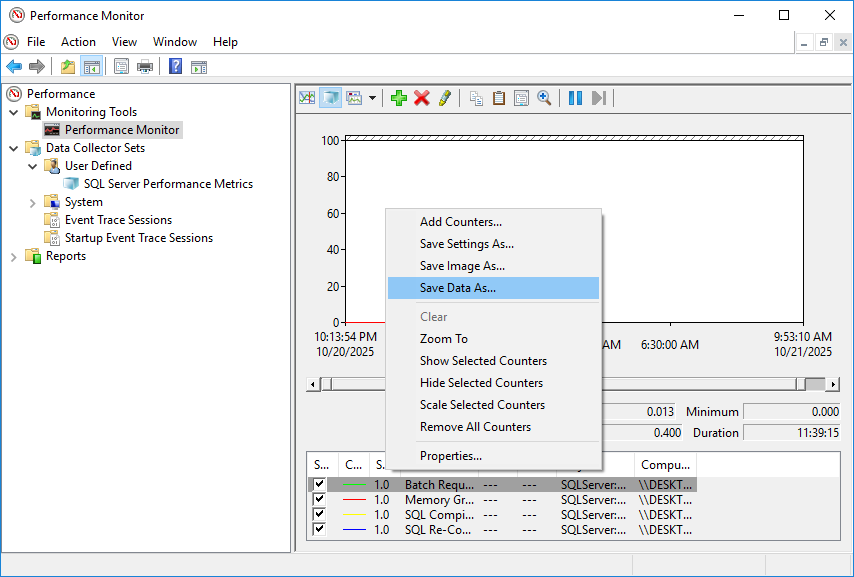
- Right-click anywhere in the graph area
- Select Save Data As
- Choose a location for the file
- Select Text File (Comma delimited) (.csv) from the dropdown
- Click Save
- Open the CSV file in Excel
Format the exported data for better analysis:
- Delete the half-empty row 2 and clear cell A1
- Format column A as Date/Time
- Format numeric columns with zero decimals and thousands separator
- Find and replace server names in headers (e.g., replace “\\SERVERNAME” with blank)
- Clean up object names in headers (e.g., “Memory”, “PhysicalDisk”, “Processor”)
- Reduce header font size to 8 points for better visibility
6.3 Interpreting Counter Values
6.3.1 Memory Counter Analysis
When analyzing memory counters, look for these indicators:
- Available MBytes: Should remain above 4096 MB consistently
- Page Life Expectancy: Values above 300 seconds indicate healthy memory. Lower values suggest memory pressure
- Buffer Cache Hit Ratio: Should meet or exceed 99%. Lower values indicate excessive disk reads
- Memory Grants Pending: Should always be 0. Any positive value indicates memory starvation
6.3.2 CPU Counter Analysis
CPU performance indicators include:
- % Processor Time: Sustained usage over 75% indicates performance issues. Spikes to 100% are normal but shouldn’t persist
- Processor Queue Length: Values above 1 indicate CPU pressure. Check Task Manager to identify which processes consume CPU
- % Privileged Time: Should stay between 5-10%. Values above 25% suggest excessive I/O operations
6.3.3 Disk Counter Analysis
Disk performance thresholds:
- Avg. Disk sec/Read and Write: Should stay below 10-20ms. Higher values indicate slow disk subsystems
- Disk Queue Length: Values consistently above 2 (or 2 per disk in RAID) indicate I/O bottlenecks
- % Disk Time: Sustained values above 85% indicate disk saturation
6.4 Using Formulas and Statistics
Add statistical formulas to Excel for quick analysis:
- Insert 7 blank rows at the top of your spreadsheet
- Add labels in column A: Average, Median, Min, Max, Std Deviation
- In cell B2, enter: =AVERAGE(B9:B100) (adjust B100 to your last data row)
- In cell B3, enter: =MEDIAN(B9:B100)
- In cell B4, enter: =MIN(B9:B100)
- In cell B5, enter: =MAX(B9:B100)
- In cell B6, enter: =STDEV(B9:B100)
- Copy formulas across all counter columns
- Select cell B9 and press Alt+W+F+Enter to freeze panes
These statistics help identify trends, outliers, and normal operating ranges for each counter.
7. Performance Analysis for Logs (PAL) Tool
7.1 Introduction to PAL
Performance Analysis for Logs (PAL) is a free tool developed by Clint Huffman that analyzes Performance Monitor logs and generates HTML reports with threshold analysis. PAL compares your performance data against known thresholds and provides detailed recommendations for SQL Server performance optimization.
Download PAL from the GitHub repository: https://github.com/clinthuffman/PAL ![]()
7.2 Setting Up PAL
Install PAL by following these steps:
- Download the PAL setup file from GitHub
- Run the installer
- Click Next on the welcome screen
- Review and accept the installation directory
- Click Next to continue
- Click Install to begin installation
- Wait for installation to complete
- Click Finish
7.3 Processing Log Files with PAL
Analyze your Performance Monitor logs using PAL:
- Launch PAL from the Start menu or installation directory
- Click the Counter Log tab
- Click Browse to select your .blg file
- Navigate to your Performance Monitor log file
- Click Open
- Click the Threshold File tab
- Select a threshold file from the dropdown (e.g., “SQL Server 2016”)
- Click the Questions tab
- Answer questions about your system configuration
- Specify whether your SQL Server is OLTP or Data Warehouse
- Enter total RAM available
- Click the Output Options tab
- Select an output directory for the HTML report
- Check HTML output format
- Click the Execute tab
- Review your selections
- Check Start execution now
- Click Finish
7.4 Analyzing PAL Reports
After PAL completes analysis, it generates an HTML report containing:
- Executive summary of performance issues
- Detailed counter analysis with charts
- Threshold violations highlighted in color
- Specific recommendations for each issue
- Historical trends and patterns
The report uses color coding to indicate severity: red for critical issues, yellow for warnings, and green for healthy metrics. Review each section to understand performance bottlenecks and follow PAL’s recommendations for optimization.
8. Alternative SQL Server Monitoring Tools
8.1 Built-in SQL Server Tools
8.1.1 SQL Server Activity Monitor
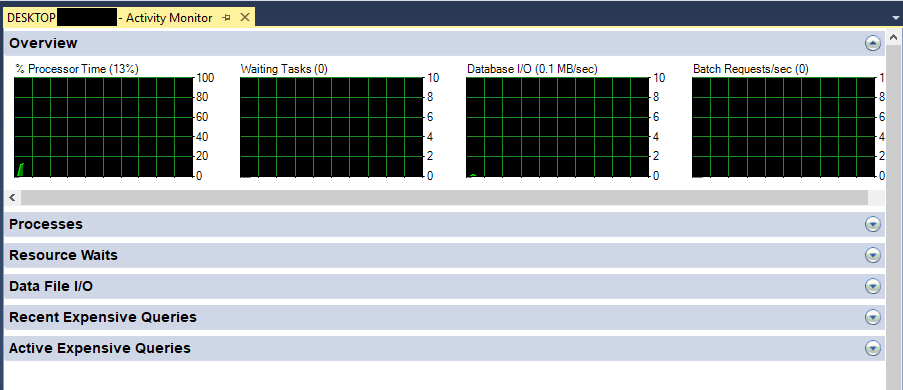
SQL Server Activity Monitor displays real-time information about SQL Server processes and performance:
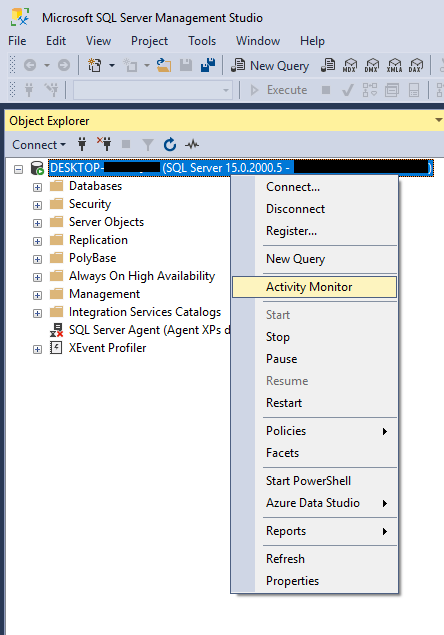
- Open SQL Server Management Studio(SSMS) and connect to your server instance
- Right-click the server name in Object Explorer
- Select Activity Monitor

Activity Monitor shows processes, resource waits, data file I/O, and recent expensive queries. It provides quick insights into current database activity but doesn’t store historical data.
8.1.2 SQL Server Performance Dashboard
SQL Server Management Studio includes built-in performance reports:
- In SQL Server Management Studio(SSMS), right-click the SQL Server instance in Object Explorer
- Select Reports -> Standard Reports
- Choose from available reports like Performance Dashboard

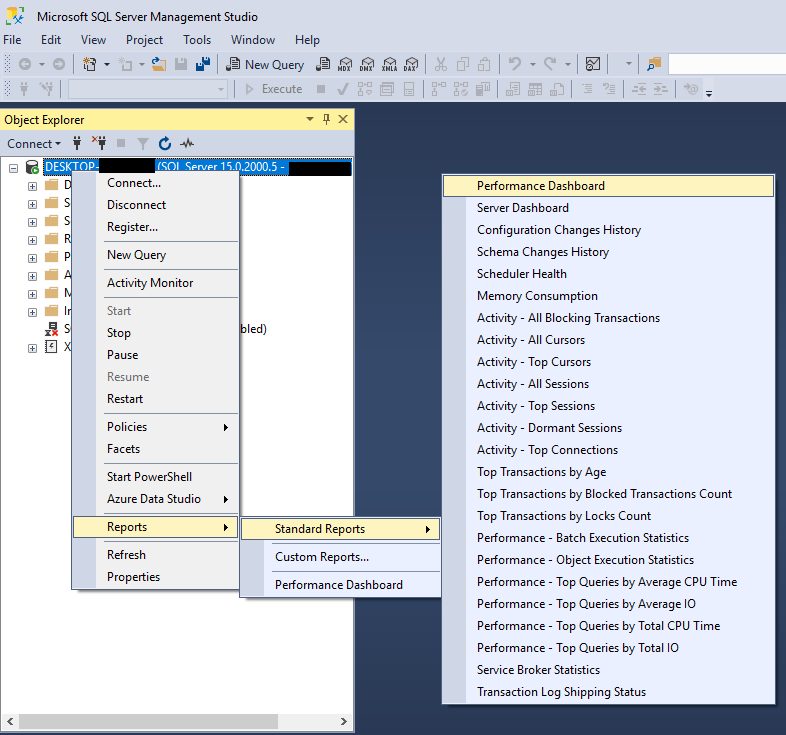
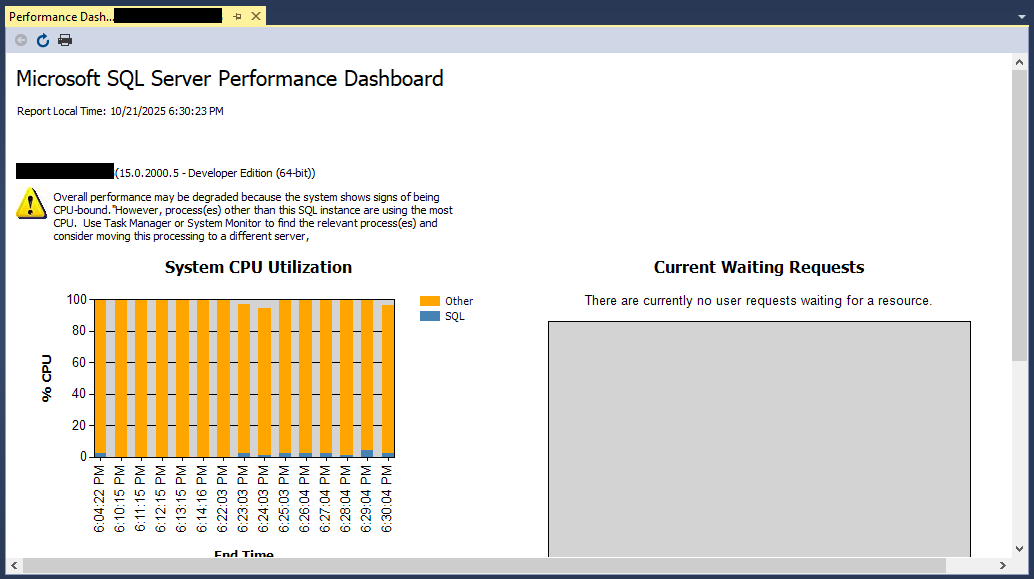
The Performance Dashboard provides visual insights into SQL Server instance performance, including system CPU utilization, current waiting requests, and performance metrics. Access it through the Standard Reports menu.
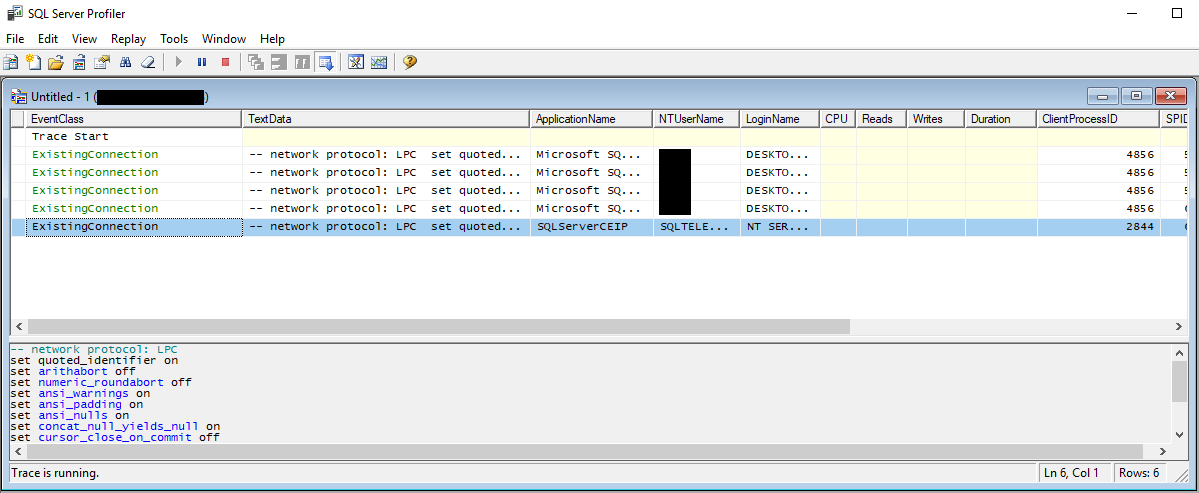
8.1.3 SQL Server Profiler
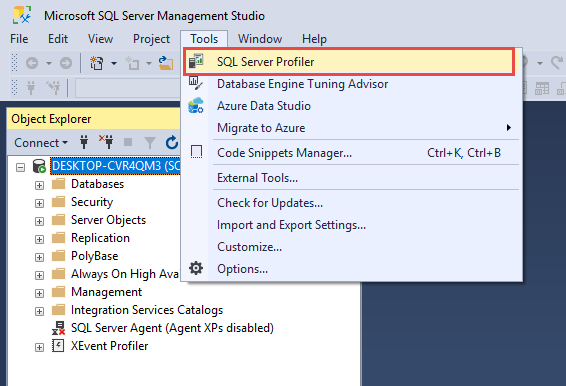
SQL Server Profiler captures and analyzes SQL Server events such as query execution, transaction operations, and login activities.
To start SQL Server Profiler:
- In SQL Server Management Studio, click Tools -> SQL Server Profiler

Profiler creates significant performance overhead, so use it judiciously and preferably during off-peak hours. For most scenarios, Extended Events provides better performance with less impact.
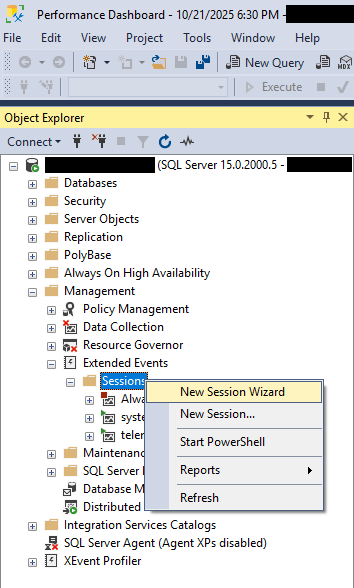
8.1.4 Extended Events
Extended Events is a lightweight performance monitoring system built into SQL Server. It replaces SQL Server Profiler with better performance and lower overhead.
Key features include:
- Fine-grained monitoring of specific events
- Minimal performance impact
- Customizable event sessions
- Integration with SSMS and other tools
- Support for complex filtering and aggregation
Create Extended Event sessions through SSMS:
- In Object Explorer, expand your server and go to Management -> Extended Events -> Sessions
- Right-click on the Sessions and choose New Session Wizard

- Follow the instructions to start a new session.
8.1.5 Dynamic Management Views (DMVs)
DMVs expose detailed server state information for monitoring health, diagnosing issues, and tuning performance. Key DMVs include:
- sys.dm_exec_query_stats: Query performance statistics
- sys.dm_os_wait_stats: Wait types affecting server performance
- sys.dm_os_performance_counters: SQL Server performance counter data
- sys.dm_exec_requests: Currently executing requests
- sys.dm_exec_sessions: Active user sessions
Query these views using T-SQL to access real-time performance data and historical metrics.
Basic Usage
-- See all active connections
SELECT * FROM sys.dm_exec_connections;

-- View current sessions
SELECT * FROM sys.dm_exec_sessions;

-- Check database file stats
SELECT * FROM sys.dm_io_virtual_file_stats(NULL, NULL);
8.2 Third-Party Monitoring Solutions
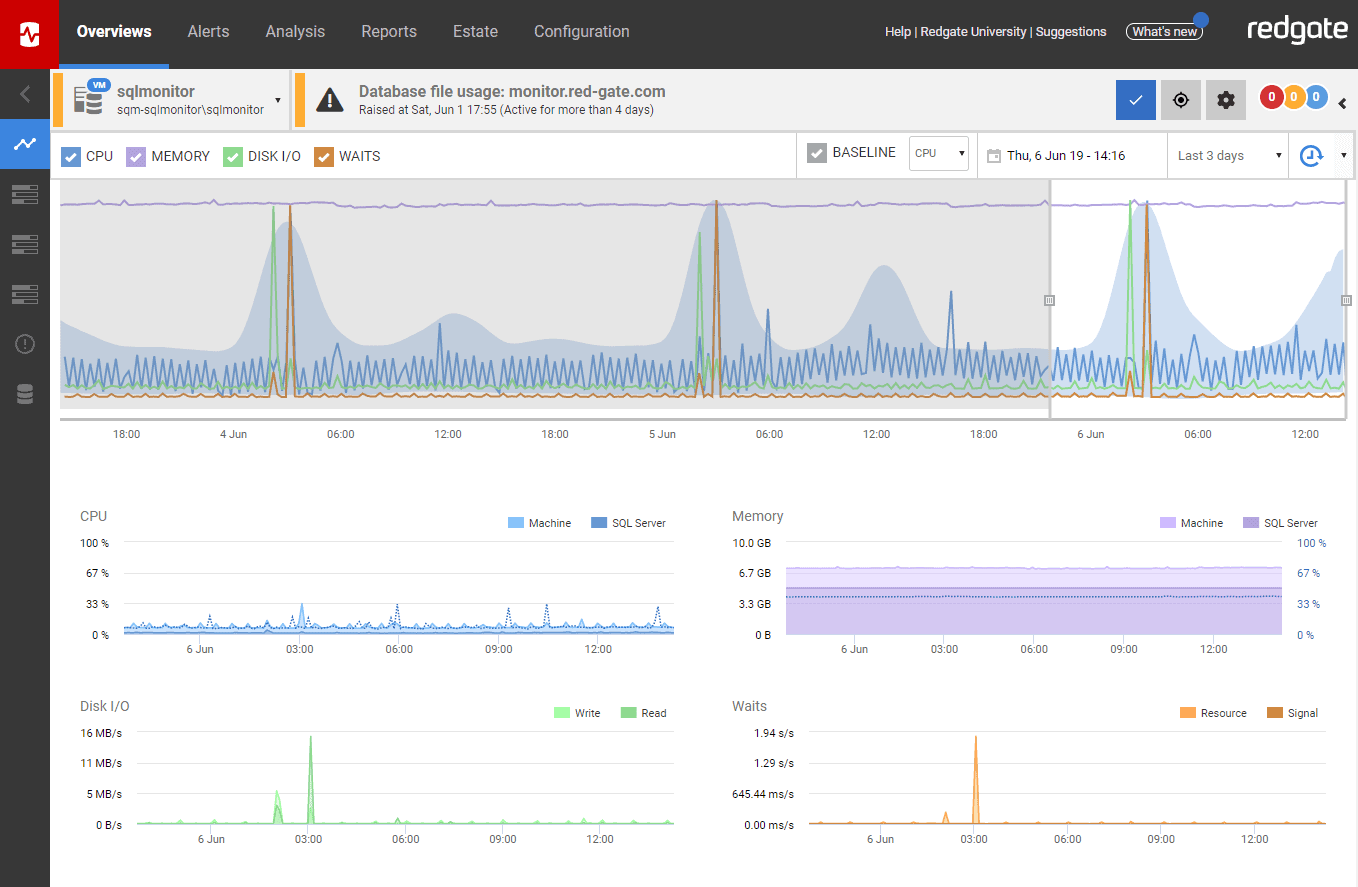
Redgate SQL Monitor
Redgate SQL Monitor specializes in monitoring SQL Server and Azure SQL Database environments. It provides estate-wide monitoring, customizable alerts and dashboards, detailed reporting capabilities, and integration with other Redgate tools.
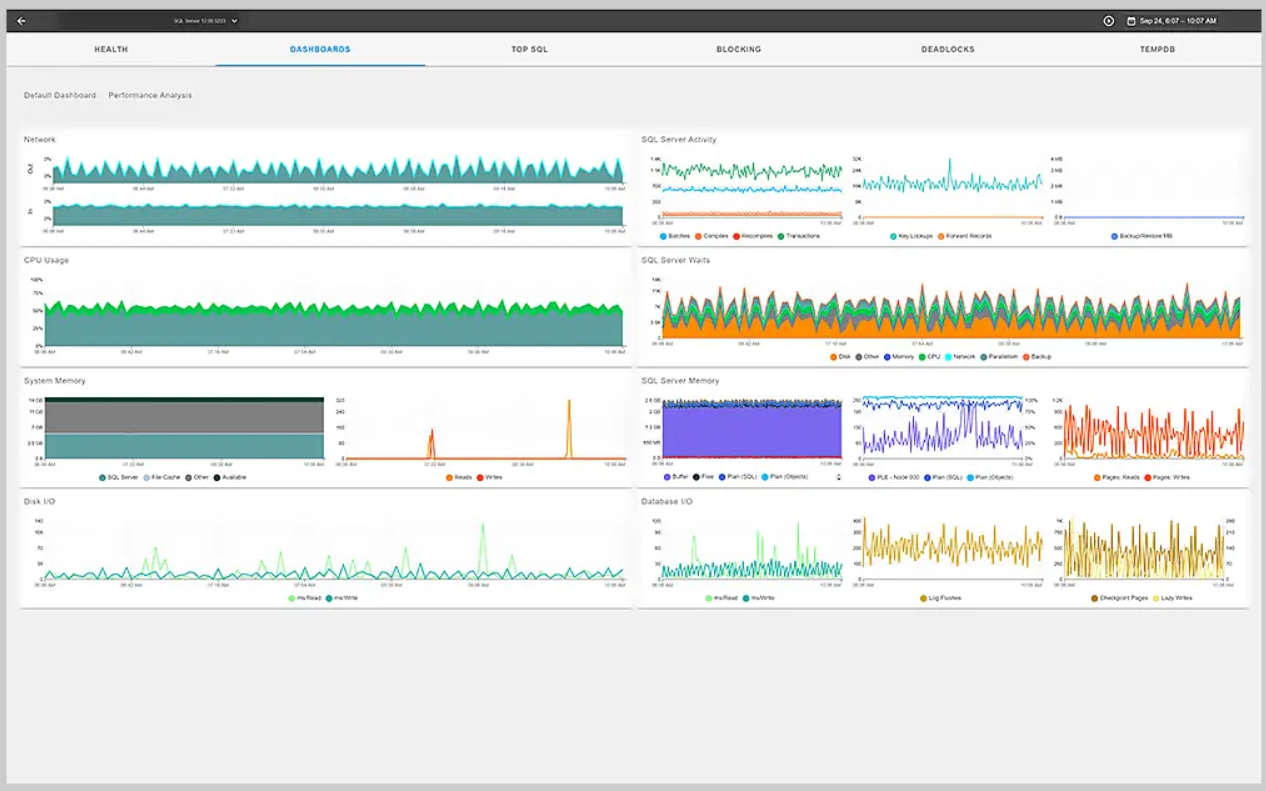
SolarWinds SQL Server Monitoring Tool
The SolarWinds SQL Server Monitoring Tool, also known as SQL Sentry, is designed to diagnose, solve, and prevent serious performance issues with SQL Server.
IDERA’s SQL Server Performance Monitoring Tool
IDERA SQL Diagnostic Manager is a powerful SQL Server performance monitoring tool designed to assist with proactive performance monitoring, diagnostics, and tuning.
Applications Manager’s SQL Monitoring
Applications Manager offers a Microsoft SQL Server Monitoring tool that provides useful IT solutions. It’s designed to oversee the performance of SQL databases, while simultaneously identifying bugs and resolving issues that could lead to halts in an organization’s operation.
8.3 Open Source Monitoring Tools
DBA Dash
DBA Dash is a free, open-source monitoring tool that provides insights into SQL Server health, performance, and activity. It’s particularly useful for small to medium-sized environments and includes daily DBA checks, performance monitoring, and configuration tracking.
SQLWATCH
SQLWATCH offers decentralized, near real-time SQL Server monitoring with 5-second granularity for capturing workload spikes. It supports Grafana for real-time dashboards and Power BI for in-depth analysis. The tool provides extensive configuration options, zero maintenance requirements, and unlimited scalability.
Opserver
Developed by Stack Exchange, Opserver monitors multiple systems including SQL Server, Redis, and Elasticsearch. It provides an “all servers” view for CPU, memory, network, and hardware statistics across your infrastructure.
sp_WhoIsActive
sp_WhoIsActive is a comprehensive activity monitoring stored procedure created by Adam Machanic. It works with all SQL Server versions from 2005 through current releases and is widely used by SQL Server DBAs for real-time activity monitoring.
To use sp_WhoIsActive, download it from http://whoisactive.com/, install it in your database, and execute:
EXEC sp_WhoIsActive
The procedure shows currently executing queries, wait information, blocking details, and resource consumption.
9. Best Practices for SQL Server Performance Monitor
9.1 Establishing Performance Baselines
Performance baselines establish normal operating parameters for your SQL Server environment. Without baselines, you cannot determine whether current metrics indicate problems or represent typical behavior.
Create baselines by:
- Collecting performance data during normal operations for at least one week
- Capturing metrics during both peak and off-peak hours
- Documenting typical values for key counters
- Recording seasonal variations if applicable
- Storing baseline data for comparison with future metrics
Update baselines quarterly or after significant infrastructure changes, application updates, or database modifications.
9.2 Setting Appropriate Alert Thresholds
Configure intelligent thresholds to receive meaningful alerts without overwhelming yourself with notifications:
- Memory Grants Pending > 0 indicates memory pressure
- Processor Queue Length > 2 per core suggests CPU bottleneck
- Disk sec/Read or Write > 20ms indicates slow I/O
- Blocked Processes > 5 signals contention issues
- Page Life Expectancy < 300 seconds indicates memory pressure
Adjust thresholds based on your baseline data and specific workload characteristics. Use adaptive thresholds that account for normal variations in your environment.
9.3 Regular Data Review and Analysis
Schedule regular performance reviews to identify trends and emerging issues:
- Daily: Review high-level metrics and recent alerts
- Weekly: Conduct in-depth analysis of performance trends
- Monthly: Generate comprehensive reports and compare against baselines
- Quarterly: Review capacity planning and long-term trends
Document findings and track performance improvements over time.
9.4 Balancing Monitoring Overhead
Monitoring itself consumes resources, so balance data collection with performance impact:
- Use 30-60 second intervals for continuous monitoring
- Use 15 second intervals only for active troubleshooting
- Limit Data Collector Set duration to avoid excessive data
- Store logs on separate drives from database files
- Archive old performance data to maintain manageable file sizes
Performance Monitor adds minimal overhead when configured properly, typically under 2% of system resources.
9.5 Long-term Data Retention
Retain performance data for meaningful trend analysis and capacity planning:
- Keep at least 1-2 years of performance data
- Archive data to separate storage after 3-6 months
- Compress older log files to save space
- Document any significant events or changes that affect performance
Given the relatively small size of performance counter data, retaining it indefinitely is often feasible and valuable for long-term analysis.
9.6 Integrating with DevOps Practices
Incorporate database performance monitoring into CI/CD pipelines:
- Include database performance metrics in deployment validation
- Automate performance testing for new releases
- Validate that code changes don’t negatively impact performance
- Create performance benchmarks for each release
- Integrate monitoring alerts with incident management systems
10. Troubleshooting Common Performance Issues
10.1 Identifying CPU Bottlenecks
CPU bottlenecks manifest as slow query response times and high processor utilization. Use these steps to diagnose CPU issues:
- Check Processor Queue Length counter. Values above 2 per core indicate CPU pressure
- Review % Processor Time. Sustained values over 75% suggest CPU bottleneck
- Remote desktop to the SQL Server
- Open Task Manager (Ctrl+Shift+Esc)
- Click the Processes tab
- Check Show processes from all users
- Click the CPU column header to sort by CPU usage
- Identify which processes consume CPU resources
If non-SQL Server applications consume significant CPU, remove them from the database server. If sqlservr.exe uses high CPU, investigate using these methods:
- Check SQL Compilations/sec and SQL Re-Compilations/sec. Values above 10% of Batch Requests/sec indicate excessive compilation
- Query sys.dm_exec_query_stats to identify CPU-intensive queries
- Review execution plans for missing indexes or inefficient operations
- Consider adding indexes to reduce table scans
10.2 Diagnosing Memory Problems
Memory issues significantly impact SQL Server performance. Diagnose memory problems using these indicators:
Available Memory Drops
If Available MBytes drops below 100 MB consistently, the operating system faces memory starvation. Windows may page out SQL Server memory to disk, causing performance degradation.
Low Page Life Expectancy
Page Life Expectancy below 300 seconds indicates high buffer cache turnover. This suggests either insufficient memory allocation or excessive memory pressure from queries.
Low Buffer Cache Hit Ratio
Buffer Cache Hit Ratio below 99% means SQL Server frequently reads data from disk rather than memory. This occurs when the buffer pool is too small or SQL Server is still warming up after restart.
Memory Grants Pending
Any value above 0 for Memory Grants Pending indicates queries are waiting for memory grants. This represents a critical memory shortage requiring immediate attention.
To resolve memory issues:
- Configure SQL Server max memory setting to leave adequate RAM for the operating system (typically 4-8 GB depending on server size)
- Enable “Lock Pages in Memory” permission for the SQL Server service account
- Add more physical RAM to the server if memory pressure persists
- Identify and optimize memory-intensive queries
10.3 Resolving Disk I/O Issues
Disk I/O frequently becomes the primary performance bottleneck in database systems. Diagnose disk issues using these methods:
High Disk Queue Length
Disk Queue Length consistently above 2 (or 2 per disk for RAID) indicates the disk subsystem cannot keep up with I/O requests. This creates a backlog of pending operations.
Excessive Disk Latency
Avg. Disk sec/Read and Avg. Disk sec/Write values above 10-20ms indicate slow disk response. Transaction log drives require especially fast performance, ideally under 5ms for writes.
High % Disk Time
Sustained % Disk Time above 85% indicates disk saturation. The disk spends most of its time processing I/O requests with little idle capacity remaining.
Before addressing disk issues, verify they aren’t symptoms of memory problems. Insufficient memory forces SQL Server to read more data from disk, artificially inflating disk metrics.
To resolve genuine disk I/O issues:
- Upgrade to faster disks (SSDs instead of HDDs)
- Implement RAID configurations for better performance
- Separate database files, transaction logs, and tempdb onto different physical drives
- Add more memory to reduce disk reads
- Optimize indexes to reduce unnecessary I/O
- Review and optimize poorly performing queries
10.4 Addressing Blocking and Deadlocks
Blocking occurs when one session holds locks that prevent other sessions from proceeding. Monitor these counters to identify blocking issues:
- Processes Blocked: Should ideally be 0
- Lock Waits/sec: Number of lock requests requiring waits
- Average Wait Time: Average duration of lock waits
To investigate blocking:
- Open Activity Monitor in SSMS
- Expand the Processes section
- Look for processes with non-zero Blocked By values
- Identify the blocking session ID
- Review the queries causing blocking
Use sp_WhoIsActive for more detailed blocking analysis. Excessive wait_info entries often indicate tempdb contention or blocking issues.
To reduce blocking:
- Minimize transaction duration
- Use appropriate isolation levels
- Add indexes to reduce lock duration
- Consider READ_COMMITTED_SNAPSHOT isolation
- Review and optimize long-running queries
10.5 Query Performance Issues
Identifying expensive queries is essential for SQL performance monitoring. Use these methods to find problematic queries:
Using Activity Monitor
- In SSMS, right-click the server name
- Select Activity Monitor
- Expand Recent Expensive Queries
- Review queries with high CPU, duration, or logical reads
Using DMVs
Query sys.dm_exec_query_stats to identify resource-intensive queries:
SELECT TOP 50
    total_worker_time/execution_count AS avg_cpu_time,
    total_logical_reads/execution_count AS avg_logical_reads,
    execution_count,
    SUBSTRING(qt.text, (qs.statement_start_offset/2)+1,
        ((CASE qs.statement_end_offset
            WHEN -1 THEN DATALENGTH(qt.text)
            ELSE qs.statement_end_offset
        END - qs.statement_start_offset)/2) + 1) AS query_text
FROM sys.dm_exec_query_stats qs
CROSS APPLY sys.dm_exec_sql_text(qs.sql_handle) qt
ORDER BY total_worker_time DESC
Analyzing Execution Plans
- In SSMS, open a new query window
- Click Display Estimated Execution Plan (Ctrl+L) or Include Actual Execution Plan (Ctrl+M)
- Execute your query
- Review the execution plan for expensive operations
- Look for table scans, index scans, or high-cost operations
Optimize queries by:
- Adding appropriate indexes
- Rewriting queries to avoid expensive operations
- Updating statistics
- Using specific column names instead of SELECT *
- Avoiding unnecessary DISTINCT or ORDER BY clauses
10.6 Detect and Fix Corrupt Database
Database corruption can cause performance degradation, data loss, and system failures. Detecting and addressing corruption quickly is critical for maintaining database health.
Database Corruption Indicators
Watch for these signs of potential corruption:
- Error messages in SQL Server error log (error 823, 824, or 825)
- Unexpected application errors when accessing specific tables
- Slow query performance on previously fast queries
- SQL Server crashes or unexpected restarts
- Suspect pages appearing in msdb.dbo.suspect_pages table
Using DBCC CHECKDB for Detection
DBCC CHECKDB is the primary tool for detecting database corruption. Run it regularly to catch issues early.
Monitoring Suspect Pages
SQL Server automatically records suspect pages in the msdb database:
SELECT
    database_id,
    file_id,
    page_id,
    event_type,
    error_count,
    last_update_date
FROM msdb.dbo.suspect_pages
WHERE event_type IN (1,2,3)
Any rows returned indicate corruption issues requiring immediate attention.
Corruption Prevention Strategies
- Enable page verification with CHECKSUM option
- Maintain regular database backups
- Use reliable hardware with error correction
- Monitor disk health using manufacturer tools
- Schedule regular DBCC CHECKDB runs
- Keep SQL Server updated with latest patches
Recovery and Repair Options
If corruptions are detected, you can try built-in tool DBCC CHECKDB to fix them. If fails, use third-party tools such as DataNumen SQL Recovery which can deal with severe corruptions.
11. Advanced Monitoring Techniques
11.1 Query Store Monitoring
Query Store, introduced in SQL Server 2016, captures query performance data automatically. It provides valuable insights into query behavior, execution plans, and performance trends.
Enabling Query Store
- In SSMS Object Explorer, right-click a database
- Select Properties
- Click the Query Store page
- In Operation Mode (Requested), select Read Write
- Configure additional settings as needed
- Click OK
Monitoring Query Performance
Access Query Store reports through Object Explorer:
- Expand the database in Object Explorer
- Expand Query Store
- Select from available reports:
- Regressed Queries
- Overall Resource Consumption
- Top Resource Consuming Queries
- Queries With Forced Plans
- Tracked Queries
Plan Regression Detection
Query Store automatically detects when query execution plans change and performance degrades. Review the Regressed Queries report to identify queries affected by plan changes.
Forced Plan Management
When Query Store identifies a better execution plan, force SQL Server to use it:
- Open the query in Query Store
- Right-click the desired plan
- Select Force Plan
This immediately improves performance without requiring code changes.
11.2 Index Maintenance Monitoring
Index fragmentation degrades query performance over time. Monitor and maintain indexes regularly to ensure optimal performance.
Fragmentation Checking
Use this query to check index fragmentation:
SELECT
    OBJECT_NAME(i.object_id) AS table_name,
    i.name AS index_name,
    ps.avg_fragmentation_in_percent,
    ps.page_count
FROM sys.dm_db_index_physical_stats(DB_ID(), NULL, NULL, NULL, 'SAMPLED') ps
INNER JOIN sys.indexes i ON ps.object_id = i.object_id
    AND ps.index_id = i.index_id
WHERE ps.avg_fragmentation_in_percent > 10
    AND ps.page_count > 1000
ORDER BY ps.avg_fragmentation_in_percent DESC
Run this query during off-peak hours as it can be resource-intensive.
Page Density Analysis
Page density indicates how full index pages are. Low density wastes space and reduces performance:
SELECT
    OBJECT_NAME(i.object_id) AS table_name,
    i.name AS index_name,
    ps.avg_page_space_used_in_percent
FROM sys.dm_db_index_physical_stats(DB_ID(), NULL, NULL, NULL, 'SAMPLED') ps
INNER JOIN sys.indexes i ON ps.object_id = i.object_id
    AND ps.index_id = i.index_id
WHERE ps.avg_page_space_used_in_percent < 75
Reorganize vs Rebuild Decisions
Choose index maintenance operations based on fragmentation levels:
- Fragmentation 10-30%: Use ALTER INDEX REORGANIZE
- Fragmentation > 30%: Use ALTER INDEX REBUILD
- Fragmentation < 10%: No action needed
Reorganize operations require fewer resources and can run online. Rebuild operations are more thorough but consume significant resources.
11.3 Database Statistics Updates
Database statistics help SQL Server’s query optimizer create efficient execution plans. Outdated statistics lead to poor query performance.
Automatic Statistics Rebuilding
Enable automatic statistics updates:
ALTER DATABASE DatabaseName SET AUTO_UPDATE_STATISTICS ON
ALTER DATABASE DatabaseName SET AUTO_CREATE_STATISTICS ON
Monitoring Statistics Health
Check when statistics were last updated:
SELECT
    OBJECT_NAME(s.object_id) AS TableName,
    s.name AS StatisticsName,
    STATS_DATE(s.object_id, s.stats_id) AS LastUpdated,
    sp.rows,
    sp.modification_counter
FROM sys.stats s
CROSS APPLY sys.dm_db_stats_properties(s.object_id, s.stats_id) sp
WHERE STATS_DATE(s.object_id, s.stats_id) < DATEADD(DAY, -7, GETDATE())
ORDER BY LastUpdated
Update statistics manually when needed:
UPDATE STATISTICS TableName WITH FULLSCAN
11.4 Collecting Custom Performance Data
Create custom performance monitoring solutions by querying sys.dm_os_performance_counters directly and storing results in tables.
Creating Custom Collection Scripts
Build a stored procedure to collect performance counter data:
CREATE PROCEDURE dbo.CollectPerformanceCounters
AS
BEGIN
    INSERT INTO dbo.PerformanceHistory (
        SampleTime,
        CounterName,
        CounterValue
    )
    SELECT
        GETDATE(),
        counter_name,
        cntr_value
    FROM sys.dm_os_performance_counters
    WHERE counter_name IN (
        'Page life expectancy',
        'Batch Requests/sec',
        'Buffer cache hit ratio'
    )
END
Using sys.dm_os_performance_counters
Query performance counters directly:
SELECT
    object_name,
    counter_name,
    instance_name,
    cntr_value,
    cntr_type
FROM sys.dm_os_performance_counters
WHERE object_name LIKE '%Buffer Manager%'
ORDER BY counter_name
Storing Historical Data
Create a table to store performance metrics over time:
CREATE TABLE dbo.PerformanceHistory (
    ID INT IDENTITY PRIMARY KEY,
    SampleTime DATETIME2 NOT NULL,
    PageLifeExpectancy BIGINT,
    BatchRequestsPerSec DECIMAL(18,4),
    BufferCacheHitRatio DECIMAL(5,2)
)

CREATE CLUSTERED COLUMNSTORE INDEX CCI_PerformanceHistory
ON dbo.PerformanceHistory
Pivoted Data Storage Methods
Store data in pivoted format with one row per sample time and one column per counter. This reduces storage space and improves query performance compared to storing one row per counter per sample.
11.5 Multi-Server Monitoring
For environments with multiple SQL Server instances, implement centralized monitoring.
Centralized Monitoring Approach
- Create a dedicated monitoring database on a separate server
- Collect data from all servers into the central repository
- Use SQL Server Agent jobs to run collection scripts
- Implement network-accessible performance counter collection
Remote Server Monitoring
Configure Performance Monitor to collect data from remote servers by specifying server names when adding counters. Ensure firewall rules allow Performance Monitor traffic.
Cross-Server Reporting
Build reports that compare performance across multiple servers to identify outliers and capacity imbalances.
12. Monitoring SQL Server in Cloud Environments
12.1 Azure SQL Database Monitoring
Azure SQL Database provides built-in monitoring capabilities that differ from on-premises SQL Server.
Azure Monitor Integration
Azure Monitor automatically collects metrics from Azure SQL Database including:
- DTU or vCore utilization
- Storage usage
- Connection statistics
- Deadlocks and timeouts
Access these metrics through the Azure Portal or Azure Monitor API.
Built-in Monitoring Features
Azure SQL Database includes:
- Automatic tuning recommendations
- Query Performance Insight
- Intelligent Insights for anomaly detection
- Built-in alerting and diagnostics
Query Performance Insight
This feature provides visualization of top resource-consuming queries, query duration analysis, and historical performance trends. Access it through the Azure Portal under your SQL Database resource.
12.2 Cloud-Native Monitoring Tools
Cloud platforms offer native monitoring solutions optimized for their environments:
- Azure Monitor and Application Insights for Azure SQL Database
- AWS CloudWatch for RDS SQL Server
- Google Cloud Monitoring for Cloud SQL Server
These tools integrate seamlessly with cloud infrastructure and provide unified monitoring across all cloud resources.
Hybrid Environment Monitoring
For hybrid deployments spanning on-premises and cloud, use tools that support both environments like Redgate SQL Monitor, SolarWinds DPA, or custom solutions using centralized data collection.
12.3 Performance Differences in Cloud
Cloud SQL Server environments have unique characteristics:
Resource Allocation Models
Cloud providers use different resource allocation methods (DTUs, vCores, serverless) that affect how you interpret performance metrics. Understand your service tier’s limitations and characteristics.
Scaling Considerations
Cloud environments offer dynamic scaling capabilities. Monitor resource utilization to determine when to scale up or down. Many cloud platforms provide automatic scaling based on performance thresholds.
13. Automating Performance Monitoring
13.1 SQL Server Agent Jobs
Automate data collection using SQL Server Agent jobs for consistent monitoring without manual intervention.
Scheduled Data Collection
- In SSMS, expand SQL Server Agent
- Right-click Jobs and select New Job
- Name the job (e.g., “Collect Performance Metrics”)
- Click Steps and add a new step
- Set Type to Transact-SQL script
- Enter your data collection script
- Click Schedules and add a schedule
- Configure frequency (e.g., every 5 minutes)
- Click OK to create the job
Automated Reporting
Create jobs that generate and email performance reports:
- Create a stored procedure that generates reports
- Use Database Mail to send reports via email
- Schedule the job to run daily or weekly
13.2 PowerShell Automation
PowerShell provides powerful automation capabilities for SQL Server performance monitor.
Performance Counter Collection Scripts
$counters = @(
    '\Processor(_Total)\% Processor Time',
    '\Memory\Available MBytes',
    '\PhysicalDisk(_Total)\Avg. Disk sec/Read'
)

$data = Get-Counter -Counter $counters -ComputerName 'SQLServer01'
$data.CounterSamples | Export-Csv 'C:\PerfLogs\counters.csv' -Append
WMI Queries
Use WMI to collect performance data from remote servers:
$cpu = Get-WmiObject Win32_Processor -ComputerName 'SQLServer01'
$memory = Get-WmiObject Win32_OperatingSystem -ComputerName 'SQLServer01'

Write-Host "CPU Usage: $($cpu.LoadPercentage)%"
Write-Host "Available Memory: $([math]::Round($memory.FreePhysicalMemory/1MB,2)) GB"
Automated Alerting
Create PowerShell scripts that check metrics and send alerts when thresholds are breached:
$cpuThreshold = 80
$cpu = (Get-Counter '\Processor(_Total)\% Processor Time').CounterSamples.CookedValue

if ($cpu -gt $cpuThreshold) {
    Send-MailMessage -To 'dba@company.com' -Subject 'High CPU Alert' `
        -Body "CPU usage is $cpu%" -SmtpServer 'smtp.company.com'
}
13.3 Creating Monitoring Dashboards
Visualize performance data with interactive dashboards for better insights.
Power BI Integration
- Connect Power BI to your performance data tables
- Create visualizations for key metrics
- Add slicers for time range and server selection
- Publish dashboards to Power BI Service
- Configure automatic refresh schedules
Real-time Dashboard Creation
Use tools like Grafana or custom web applications to create real-time dashboards that query DMVs and performance counters directly.
Historical Trend Visualization
Build line charts showing trends over time for:
- CPU utilization
- Memory usage
- Disk I/O
- Query performance
- Connection counts
14. Case Studies and Practical Examples
14.1 Case Study: Resolving Memory Pressure
Symptom Identification
A production SQL Server experienced slow query response times during peak hours. Users complained about application timeouts and degraded performance.
Counter Analysis
Performance Monitor data revealed:
- Page Life Expectancy dropped to 50 seconds (normal: >300)
- Buffer Cache Hit Ratio fell to 85% (normal: >99%)
- Memory Grants Pending frequently showed values of 5-10
- Physical Disk Reads/sec spiked significantly
Resolution Steps
- Checked SQL Server max memory setting – discovered it was set to default (unlimited)
- Reviewed Total Server Memory vs Target Server Memory – showed significant gap
- Configured max server memory to leave 8 GB for the operating system
- Enabled “Lock Pages in Memory” permission for SQL Server service account
- Added 32 GB additional RAM to the server
- Monitored performance for one week – Page Life Expectancy stabilized above 500 seconds
Result: Query response times improved by 60%, user complaints ceased, and application performance returned to normal.
14.2 Case Study: CPU Performance Optimization
Symptom Identification
A SQL Server consistently showed CPU utilization above 90% during business hours, causing slow application performance and user frustration.
Counter Analysis
Performance monitoring revealed:
- % Processor Time averaged 92% with frequent spikes to 100%
- Processor Queue Length consistently above 4 (server had 8 cores)
- SQL Compilations/sec was 25% of Batch Requests/sec (should be <10%)
- SQL Re-Compilations/sec was 15% of Batch Requests/sec
Resolution Steps
- Used DMVs to identify top CPU-consuming queries
- Analyzed execution plans for identified queries
- Discovered multiple table scans on large tables due to missing indexes
- Created appropriate indexes based on execution plan recommendations
- Identified dynamic SQL causing excessive compilations
- Modified application code to use parameterized queries
- Implemented plan guide for problematic stored procedures
- Updated statistics on heavily-used tables
Result: CPU utilization dropped to 45% average during business hours. Query execution times improved by 70%. Application responsiveness significantly improved.
14.3 Case Study: Disk I/O Bottleneck Resolution
Symptom Identification
Users reported extremely slow application response during data loading operations and evening batch processing.
Counter Analysis
Performance data showed:
- Avg. Disk sec/Write exceeded 45ms on transaction log drive
- Disk Queue Length averaged 12 on data file drive
- % Disk Time stayed above 95% for hours during batch jobs
- Page Writes/sec was exceptionally high
Resolution Steps
- Verified memory settings were appropriate – found no memory issues
- Analyzed disk configuration – discovered all files on same spindle set
- Separated transaction logs to dedicated fast SSD drives
- Moved tempdb to separate SSD drives
- Implemented multiple tempdb data files (one per core)
- Upgraded data file drives to RAID 10 SSD configuration
- Optimized batch jobs to use smaller transaction batches
- Added indexes to reduce unnecessary table scans during batch operations
Result: Avg. Disk sec/Write dropped to 3ms. Disk Queue Length averaged below 1. Batch job completion time reduced by 75%.
15. Future Trends in SQL Server Monitoring
15.1 AI and Machine Learning Integration
Artificial intelligence and machine learning are transforming SQL Server performance monitor.
Predictive Analytics
Machine learning models predict future resource needs based on historical data. These systems can forecast:
- When storage capacity will be exhausted
- Expected CPU and memory requirements during peak periods
- Query performance degradation before it impacts users
- Optimal times for maintenance operations
Anomaly Detection
AI-driven tools automatically detect unusual patterns in performance metrics. They identify anomalies that human administrators might miss and distinguish between normal variations and genuine issues.
Automated Remediation
Self-healing systems automatically resolve common issues when detected:
- Restart services that have stopped
- Reallocate resources during peak load
- Apply hotfixes for known issues
- Rebuild fragmented indexes automatically
15.2 Cloud-Based Monitoring Evolution
Cloud monitoring continues to evolve with new capabilities.
Unified Monitoring Platforms
Modern platforms provide single-pane-of-glass visibility across:
- On-premises SQL Server instances
- Cloud-hosted databases
- Hybrid environments
- Application performance
- Infrastructure metrics
Observability Trends
The shift from monitoring to observability emphasizes:
- Understanding system behavior from outputs
- Correlating metrics, logs, and traces
- Deep insights into distributed systems
- Real-time problem diagnosis
15.3 Self-Healing Database Systems
Future SQL Server versions will include more autonomous capabilities.
Automatic Optimization
Databases will continuously optimize themselves by:
- Automatically creating and dropping indexes based on workload
- Adjusting configuration settings for optimal performance
- Rewriting inefficient queries transparently
- Managing resource allocation dynamically
Intelligent Tuning
Advanced systems will learn from performance patterns and apply tuning recommendations automatically, reducing the need for manual DBA intervention.
16. Conclusion and Key Takeaways
16.1 Summary of Essential Monitoring Practices
Effective SQL Server performance monitor requires a comprehensive approach combining tools, techniques, and best practices.
Critical Counters Recap
Focus monitoring efforts on these essential counters:
- Memory: Page Life Expectancy, Buffer Cache Hit Ratio, Memory Grants Pending
- CPU: % Processor Time, Processor Queue Length
- Disk: Avg. Disk sec/Read and Write, Disk Queue Length
- SQL Server: Batch Requests/sec, Compilations/sec, User Connections
Best Practice Summary
- Establish baselines during normal operations
- Set intelligent alert thresholds based on baselines
- Review performance data regularly
- Balance monitoring overhead with data granularity
- Retain long-term data for trend analysis
- Use appropriate tools for each monitoring scenario
16.2 Continuous Improvement Approach
SQL Server performance monitor is not a one-time activity but an ongoing process requiring continuous refinement.
Regular Review Cycles
- Daily: Check alerts and current performance
- Weekly: Review trends and identify emerging issues
- Monthly: Analyze long-term patterns and capacity needs
- Quarterly: Update baselines and review monitoring effectiveness
Staying Current with Tools
Keep monitoring tools and techniques up-to-date:
- Evaluate new monitoring features in SQL Server updates
- Test emerging third-party tools
- Attend training and conferences
- Participate in SQL Server community forums
- Share knowledge with team members
16.3 Next Steps
Implement SQL Server performance monitor systematically:
Implementation Roadmap
- Week 1: Set up Performance Monitor with essential counters
- Week 2: Create Data Collector Sets for automated collection
- Week 3: Establish baselines during normal operations
- Week 4: Configure alerts for critical thresholds
- Month 2: Implement additional monitoring tools (DMVs, Extended Events)
- Month 3: Develop custom dashboards and reports
- Ongoing: Refine monitoring based on experience and changing requirements
Additional Resources
Continue learning about SQL Server performance monitor through Microsoft documentation, community blogs, and hands-on practice. Experiment with different tools and techniques to find what works best for your environment.
17. Frequently Asked Questions (FAQ)
17.1 What are the most important SQL Server performance counters to monitor?
The most critical SQL Server performance counters include:
- Memory: Page Life Expectancy (should be >300 seconds) and Buffer Cache Hit Ratio (should be >99%)
- CPU: % Processor Time (sustained values <75%) and Processor Queue Length (should be <2 per core)
- Disk: Avg. Disk sec/Read and Write (should be <10-20ms) and Disk Queue Length (should be <2 per disk)
- SQL Server: Batch Requests/sec, SQL Compilations/sec, and Memory Grants Pending (should be 0)
These counters provide comprehensive insight into system health and help identify bottlenecks quickly.
17.2 How often should I collect performance data?
Collection frequency depends on your monitoring objectives:
- Baseline monitoring: Every 1 minute (60 seconds)
- Active troubleshooting: Every 15-30 seconds for short periods
- Long-term trending: Every 5 minutes
Avoid running high-frequency collection continuously as it can impact performance and generate excessive data. Use longer intervals for routine monitoring and shorter intervals only when investigating specific issues.
17.3 What’s the difference between Performance Monitor and SQL Server Profiler?
Performance Monitor and SQL Server Profiler serve different purposes:
Performance Monitor:
- Monitors system and SQL Server performance counters
- Tracks resource utilization (CPU, memory, disk)
- Low overhead, suitable for continuous monitoring
- Provides aggregate metrics over time
SQL Server Profiler:
- Traces individual SQL Server events and queries
- Captures detailed query execution information
- Higher overhead, not recommended for continuous use
- Best for troubleshooting specific query issues
- Deprecated in favor of Extended Events
Use Performance Monitor for overall system monitoring and Extended Events (not Profiler) for detailed query-level analysis.
17.4 Can Performance Monitor impact SQL Server performance?
When configured properly, Performance Monitor has minimal impact on SQL Server performance, typically less than 2% overhead. However, excessive monitoring can cause issues:
- Too many counters increases overhead
- Very short sample intervals (under 15 seconds) strain resources
- Continuous high-frequency collection generates large log files
To minimize impact:
- Monitor only necessary counters
- Use appropriate sample intervals (60 seconds for routine monitoring)
- Store logs on drives separate from database files
- Schedule resource-intensive monitoring during off-peak hours
17.5 How long should I retain performance monitoring data?
Retention depends on your analysis needs and storage capacity:
- Minimum: 3 months for troubleshooting recent issues
- Recommended: 1-2 years for capacity planning and trend analysis
- Optimal: Indefinitely if storage permits, as historical data becomes more valuable over time
Performance counter data compresses well and consumes relatively little space. Consider archiving older data to separate storage rather than deleting it. Many organizations find that years of historical data prove invaluable for capacity planning and identifying long-term trends.
17.6 What are good threshold values for key performance counters?
Recommended threshold values for alerting:
- Memory Grants Pending: Alert when > 0
- Page Life Expectancy: Alert when < 300 seconds
- % Processor Time: Alert when > 80% for 5 minutes
- Processor Queue Length: Alert when > 2 per core
- Avg. Disk sec/Read or Write: Alert when > 20ms
- Disk Queue Length: Alert when > 2 per disk
- Blocked Processes: Alert when > 5
Adjust these thresholds based on your baseline data and specific workload characteristics. What’s normal for one environment may indicate problems in another.
17.7 How do I monitor SQL Server performance remotely?
Monitor remote SQL Server instances using these methods:
- Performance Monitor: Specify the remote computer name when adding counters
- PowerShell: Use the -ComputerName parameter with Get-Counter
- DMVs: Connect to remote servers through SSMS and query DMVs
- Third-party tools: Most monitoring tools support remote server monitoring
Ensure firewall rules allow Performance Monitor traffic and that you have appropriate permissions on the remote server. For multiple servers, consider implementing centralized monitoring with a dedicated monitoring server and database.
17.8 What’s the best free tool for SQL Server performance monitor?
Several excellent free tools are available for monitoring SQL Server performance:
- Windows Performance Monitor: Built-in, comprehensive, and reliable
- SSMS Activity Monitor: Real-time monitoring with no additional installation
- Extended Events: Lightweight event monitoring built into SQL Server
- sp_WhoIsActive: Popular free stored procedure for detailed activity monitoring
- DBA Dash: Open-source monitoring tool with comprehensive features
- SQLWATCH: Open-source with near real-time monitoring capabilities
For most organizations, Performance Monitor combined with SSMS tools and sp_WhoIsActive provides excellent monitoring capabilities at no additional cost.
17.9 How do I export PerfMon data for analysis?
Export Performance Monitor data using these methods:
Export to CSV:
- Open Performance Monitor with your log file loaded
- Right-click the graph and select Save Data As
- Choose Text File (Comma delimited) (.csv)
- Select location and save
- Open in Excel for analysis
Use Relog Command:
relog input.blg -f csv -o output.csv
This command-line utility converts binary log files (.blg) to CSV format for easier analysis in spreadsheet applications.
17.10 When should I use third-party monitoring tools instead of built-in options?
Consider third-party tools when:
- Managing large numbers of SQL Server instances (10+)
- Requiring centralized monitoring across multiple data centers
- Needing advanced features like predictive analytics or anomaly detection
- Wanting integrated alerting with incident management systems
- Requiring compliance reporting and historical analysis
- Lacking DBA resources to build and maintain custom solutions
- Monitoring heterogeneous database environments (SQL Server, Oracle, MySQL, etc.)
Built-in tools work well for smaller environments or when you have skilled DBAs who can develop custom monitoring solutions. Third-party tools provide value through time savings, advanced features, and professional support.
18. Additional Resources
18.1 Official Documentation
Microsoft provides extensive documentation for SQL Server performance monitor:
- SQL Server Performance Monitor documentation: https://learn.microsoft.com/en-us/sql/relational-databases/performance-monitor/
- Dynamic Management Views: https://learn.microsoft.com/en-us/sql/relational-databases/system-dynamic-management-views/
- Extended Events: https://learn.microsoft.com/en-us/sql/relational-databases/extended-events/
- Query Store: https://learn.microsoft.com/en-us/sql/relational-databases/performance/monitoring-performance-by-using-the-query-store
- Performance tuning and monitoring: https://learn.microsoft.com/en-us/sql/relational-databases/performance/
18.2 Recommended Tools and Downloads
Essential tools for SQL Server performance monitor:
- PAL Tool: https://github.com/clinthuffman/PAL
- sp_WhoIsActive: http://whoisactive.com/
- DBA Dash: https://dbadash.com/
- SQLWATCH: https://github.com/marcingminski/sqlwatch
- First Responder Kit (Brent Ozar): https://www.brentozar.com/first-aid/
- SQL Server Management Studio: https://learn.microsoft.com/en-us/sql/ssms/download-sql-server-management-studio-ssms
18.3 Community Resources
Learn from the SQL Server community:
- SQL Server Central: https://www.sqlservercentral.com/
- Brent Ozar Blog: https://www.brentozar.com/blog/
- SQL Shack: https://www.sqlshack.com/
- MSSQLTips: https://www.mssqltips.com/
- Reddit r/SQLServer: https://www.reddit.com/r/SQLServer/
- Stack Overflow SQL Server tag: https://stackoverflow.com/questions/tagged/sql-server
These resources provide tutorials, troubleshooting advice, and best practices from experienced SQL Server professionals. Participating in community forums helps you learn from others’ experiences and share your own knowledge.
About the Author
Yuan Sheng is a senior database administrator (DBA) with over 10 years of experience in SQL Server environments and enterprise database management. He has successfully resolved hundreds of database recovery scenarios across financial services, healthcare, and manufacturing organizations.
Yuan specializes in SQL Server database recovery, high availability solutions, and performance optimization. His extensive hands-on experience includes managing multi-terabyte databases, implementing Always On Availability Groups, and developing automated backup and recovery strategies for mission-critical business systems.
Through his technical expertise and practical approach, Yuan focuses on creating comprehensive guides that help database administrators and IT professionals solve complex SQL Server challenges efficiently. He stays current with the latest SQL Server releases and Microsoft’s evolving database technologies, regularly testing recovery scenarios to ensure his recommendations reflect real-world best practices.
Have questions about SQL Server recovery or need additional database troubleshooting guidance? Yuan welcomes feedback and suggestions for improving these technical resources.