1. Introduction
1.1 What Are SQL Server Extended Events?
SQL Server Extended Events is a lightweight performance monitoring system that enables administrators and developers to collect and analyze detailed server activity data. This system is integrated into the SQL Server Database Engine and provides comprehensive insights into both normal operations and troubleshooting scenarios.
1.2 Why Use Extended Events for Monitoring?
SQL Server Extended Events offers several compelling advantages for database monitoring and troubleshooting:
- Minimal performance impact with lightweight architecture
- Granular control over data collection and event filtering
- Customizable data collection tailored to specific monitoring needs
- Ability to capture events from multiple packages simultaneously
- Flexible filtering capabilities to focus on relevant operations
- Support for production system monitoring without degrading user experience
- Comprehensive performance metrics tracking
- Advanced diagnostic capabilities for troubleshooting
- Audit trail maintenance for compliance requirements
- Real-time and historical data analysis options
1.3 Extended Events vs SQL Server Profiler
While SQL Server Profiler has been a traditional monitoring tool, MS SQL Extended Events provides a more efficient alternative. Extended Events consumes fewer system resources and offers better scalability for production environments.
SQL Server Profiler is now deprecated, and Microsoft recommends migrating to Extended Events for all monitoring activities.
2. Understanding Extended Events Architecture
2.1 Extended Events Engine Components
The Extended Events engine consists of several core components that work together to capture, process, and store event data. Understanding these components helps you design effective monitoring solutions.
- Dispatcher: The dispatcher component coordinates event flow from event sources to the Extended Events engine. When an event fires, the dispatcher receives the notification and routes it to active sessions that have subscribed to that specific event type.
- Buffer: Buffers temporarily store event data in memory before writing to targets. This buffering mechanism improves performance by reducing I/O operations. Buffer size and management settings can be configured to balance memory usage with data capture requirements.
- Session: A session defines the scope of event monitoring. It specifies which events to capture, what actions to execute, which predicates to apply, and where to store the results. Sessions can be created, modified, started, and stopped independently.
- Target Instance: Target instances represent the storage destinations for captured event data. Each session can write to one or multiple targets, such as files, ring buffers, or counters. Targets process and persist the event information for later analysis.
2.2 Event Packages
SQL Server Extended Events organizes functionality into packages. Each package contains related events, actions, types, predicates, and targets. Common packages include sqlserver, sqlos, and package0.
- The sqlserver package provides database-specific events like queries and transactions.
- The sqlos package contains operating system events.
- The package0 offers general-purpose functionality used across all packages.
2.3 Event Types and Fields
Events represent occurrences within SQL Server that you want to monitor. Each event type has predefined fields that capture relevant information. For example, the sql_statement_completed event includes fields for duration, CPU time, reads, and writes.
Events can be synchronous or asynchronous. Synchronous events fire during the operation itself, while asynchronous events fire after completion. Understanding event characteristics helps you select appropriate events for your monitoring needs.
2.4 Actions
Actions add supplementary information to captured events. When an event fires, associated actions execute to collect additional context such as SQL text, session ID, or call stack information.
Common actions include sql_text to capture query statements, database_name to identify the database, and client_hostname to track the originating server. Actions provide essential context for troubleshooting and analysis.
2.5 Targets
Targets determine how and where event data is stored. SQL Server Extended Events supports multiple target types, including:
- event_file for disk storage, providing persistent storage for detailed analysis
- ring_buffer for memory-based retention, offering quick access to recent events with minimal overhead
- event_counter for simple counting
- histogram for grouping
- pair_matching for correlating related events
2.6 Predicates (Filters)
Predicates filter events based on specified conditions, reducing the volume of captured data. You can filter by database name, application name, session ID, duration thresholds, or any event field value.
Effective predicate use minimizes performance impact by capturing only relevant events. Complex predicates combine multiple conditions using logical operators to create precise filtering criteria.
3. Extended Event Session States and Lifecycle
3.1 Session States: CREATE, ALTER, and DROP
Extended Event sessions progress through distinct states:
- The CREATE EVENT SESSION statement defines a new session but does not start it. The session exists in a stopped state until explicitly activated.
- The ALTER EVENT SESSION statement modifies session configuration or changes its state between stopped and started.
- The DROP EVENT SESSION statement removes the session definition entirely from the server.
3.2 Session Content and Characteristics
Each session contains a collection of events, actions, targets, and predicates. Sessions have implied boundaries that define their scope and behavior. Configuration options control memory allocation, event retention, and dispatch latency.
Session characteristics include whether they persist across server restarts, maximum memory allocation, and how they handle memory pressure. These settings significantly impact session behavior and resource consumption.
3.3 Session Boundaries and Packages
Session boundaries define relationships between events, targets, and packages. Events from one package can trigger actions from another package, providing flexibility in data collection strategies.
Package relationships allow you to combine events from multiple sources within a single session. This capability enables comprehensive monitoring scenarios that span different SQL Server subsystems.
4. Creating Extended Event Sessions Using SSMS
4.1 Prerequisites and Setup
Before creating SQL Server Extended Events sessions, ensure you have appropriate permissions. You need ALTER ANY EVENT SESSION permission for server-scoped sessions or CONTROL permission on the database for database-scoped sessions.
Verify that SQL Server Management Studio is installed and connected to your target instance. Familiarize yourself with the monitoring requirements and identify which events and targets best suit your needs.
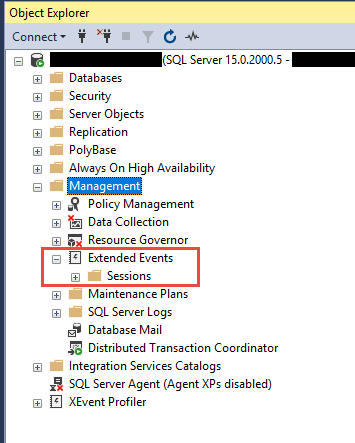
4.2 Accessing Extended Events in Object Explorer
To access the Extended Events interface in SSMS, follow these steps:
- Open SQL Server Management Studio and connect to your SQL Server instance.
- In Object Explorer, expand Management -> Extended Events.
- The Extended Events node contains Sessions and Packages folders for managing your monitoring configurations.
4.3 Create a New Session
To create a new session:
-
- Right-click on the Sessions folder under Extended Events.
- Select New Session to open the configuration dialog. The following content will use this method to create a new session.
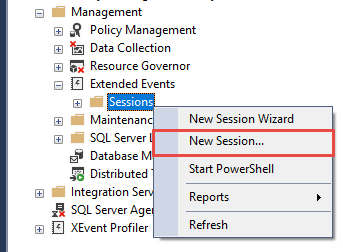
Note: The New Session Wizard is also available for a more guided experience.
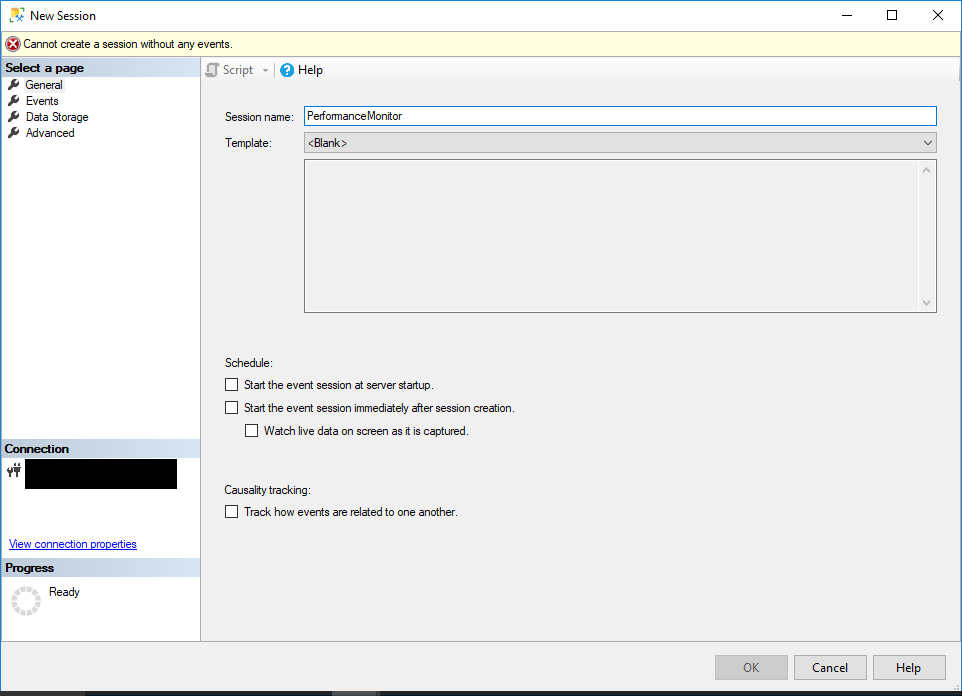
4.3.1 General Page Configuration
On the General page, configure basic session properties:
- Enter a session name in the Session name field. Use descriptive names that indicate the monitoring purpose.
- Optionally select Start the event session at server startup to enable automatic session activation.
- The default session template is Blank. You can use other templates if using a predefined configuration.
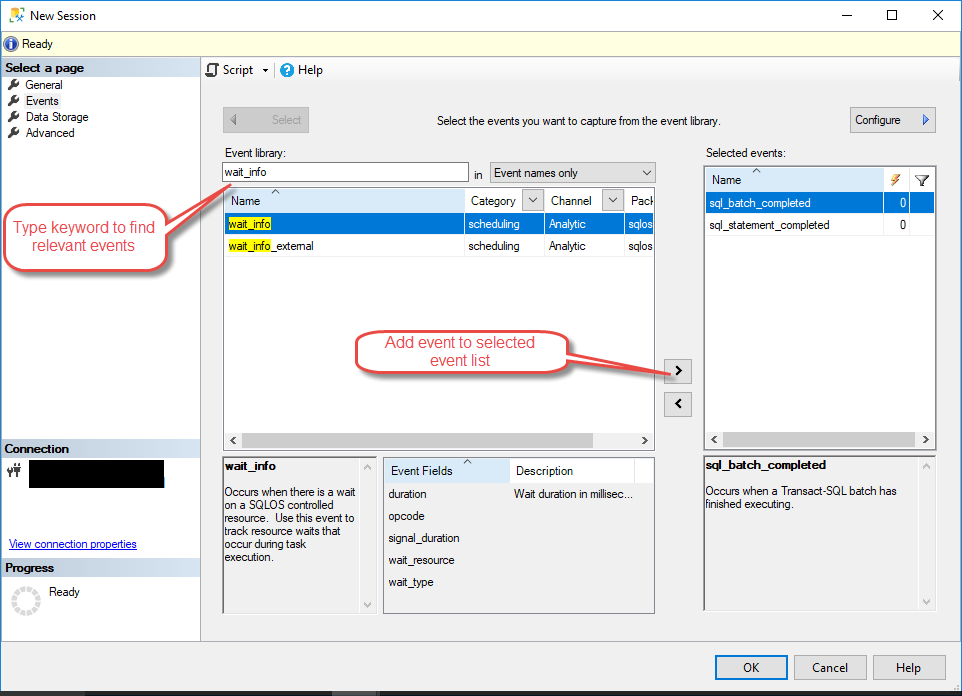
4.3.2 Events Page Setup
The Events page allows you to select which events to monitor:
- Select the Events page from the left Select a page panel.
- In the Event library, browse available events or use the search function.
- Filter events by typing keywords such as “sql_statement_completed” to find relevant events.
- Select the desired event, such as sql_statement_completed.
- Click the right arrow button to move the event to the Selected events list.
4.3.3 Data Storage Configuration
The Data Storage page defines where event data is stored:
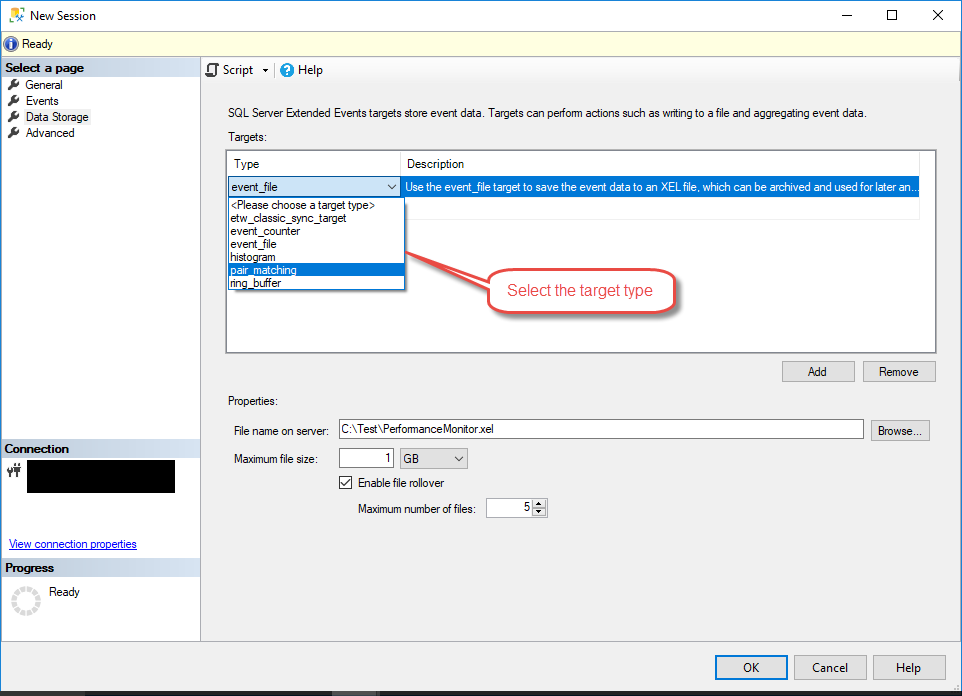
- Select the Data Storage page from the left Select a page panel.
- In the Targets area, choose a target type from the dropdown.
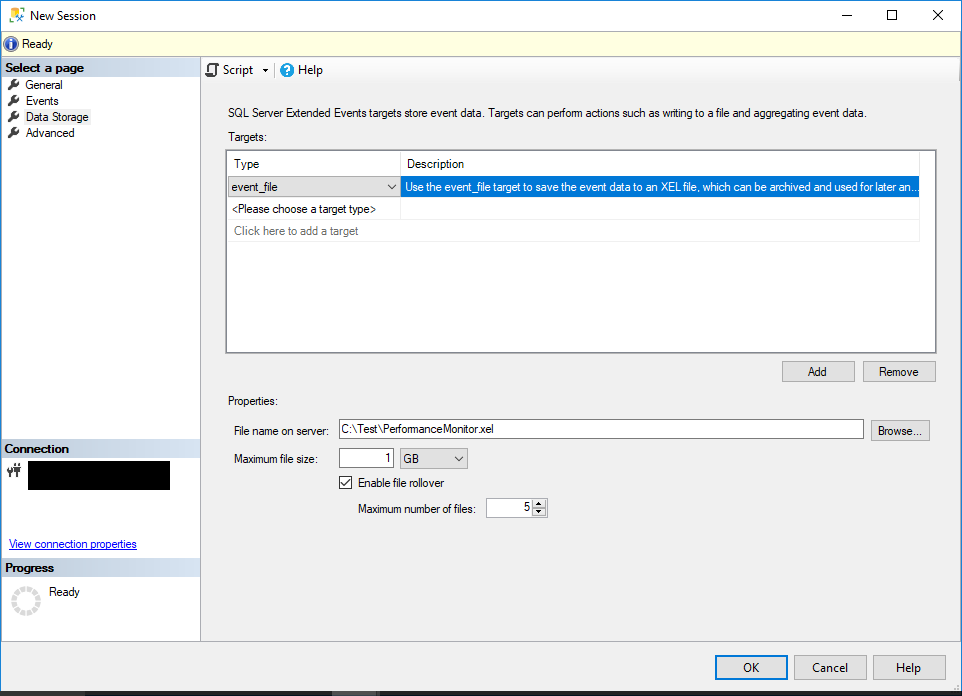
(1) event_file Target
The event_file target stores data to disk files with the .xel extension:
- Select event_file from the target type dropdown.
- Specify the file path, such as C:\temp\YourSession_Target.xel.
- Configure rollover options to manage disk space by setting maximum file size and file count.
- The target writes events continuously until the session stops or storage limits are reached.
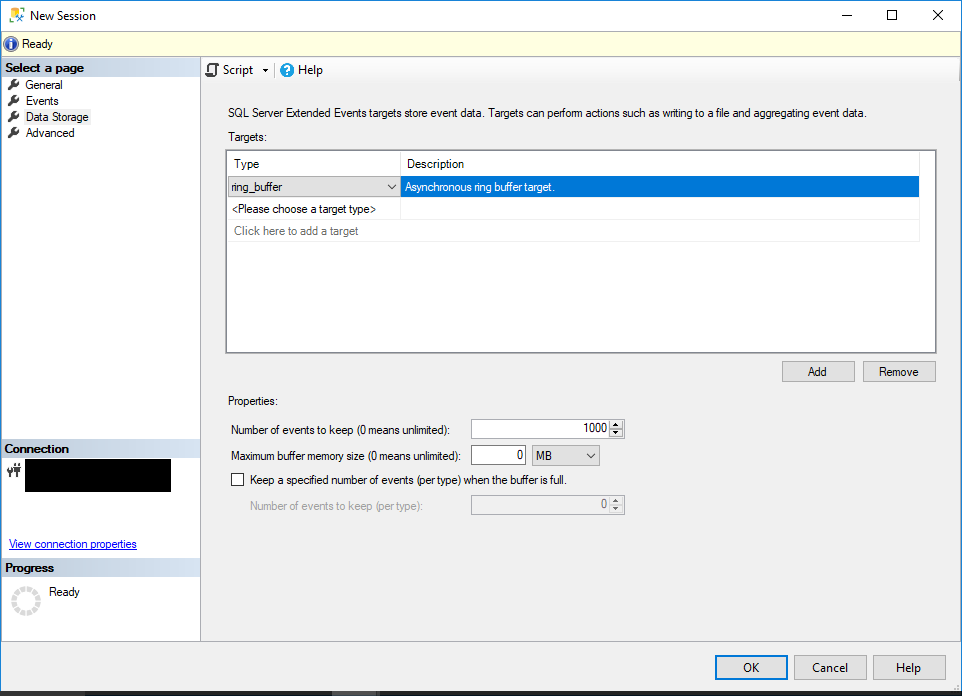
(2) ring_buffer Target
The ring_buffer target stores events in memory for quick access without disk I/O:
- Select ring_buffer as the target type.
- Configure the maximum memory allocation for the buffer.
- Understand that older events are discarded when the buffer fills, making this suitable for recent activity monitoring.
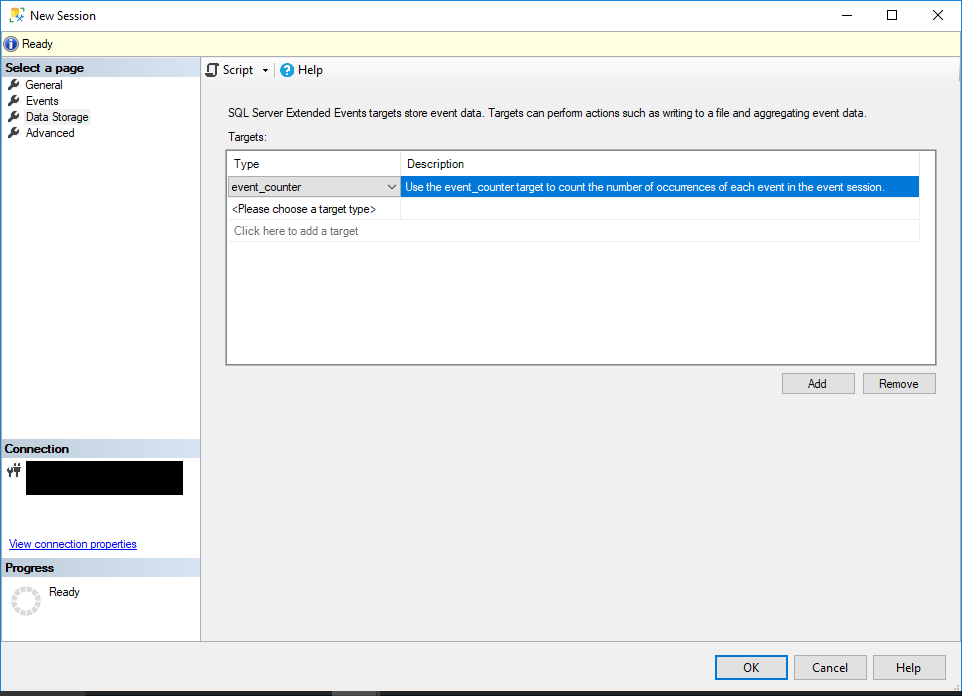
(3) event_counter Target
The event_counter target simply counts event occurrences without storing detailed data. This provides minimal overhead when you only need frequency information.
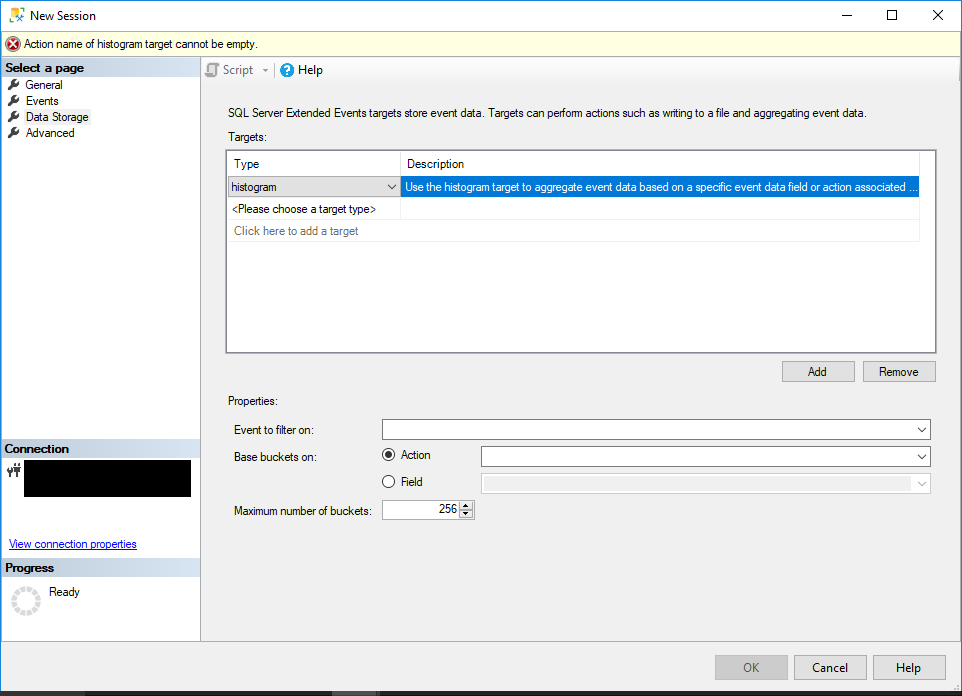
(4) histogram Target
The histogram target groups events by a specified field value, creating distribution statistics. This is useful for identifying common patterns or high-frequency values.
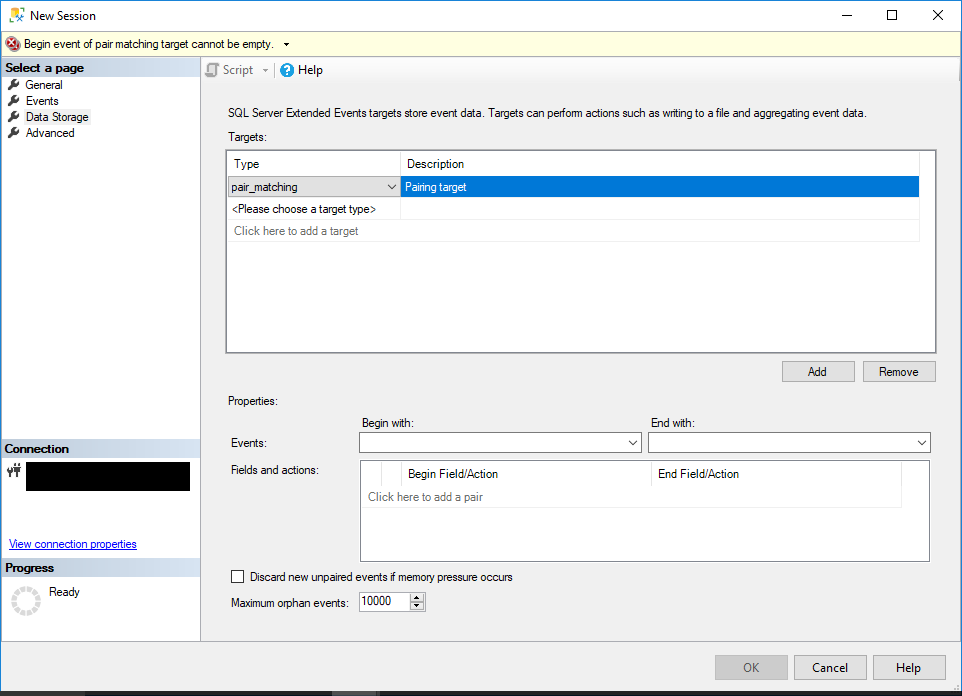
(5) pair_matching Target
The pair_matching target correlates related events such as lock acquisition and release. This enables analysis of paired operations and their timing relationships.
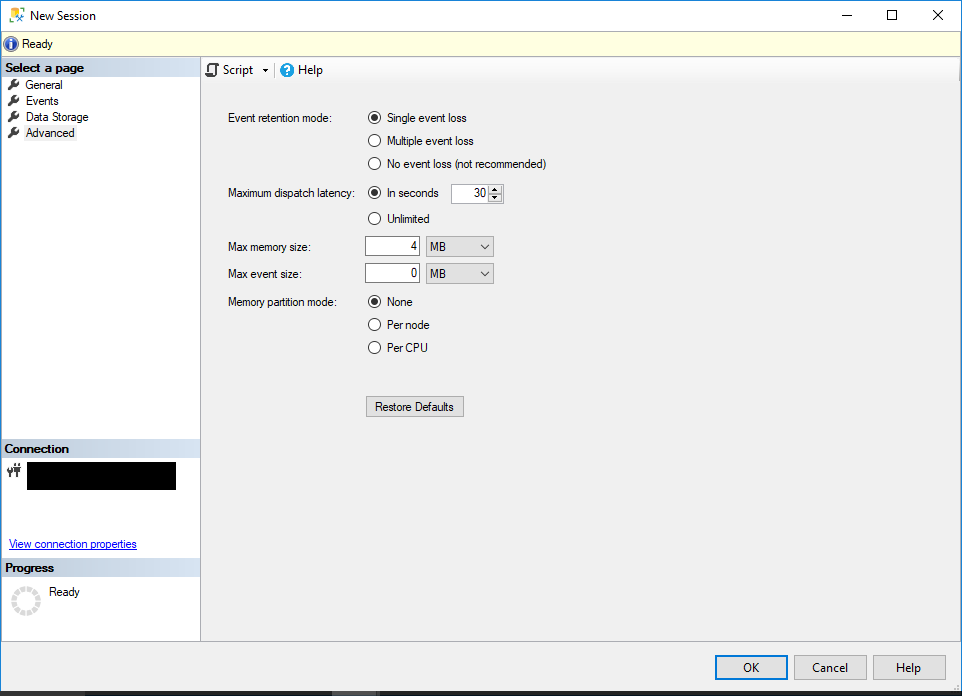
4.3.4 Advanced Settings
The Advanced page provides session-level configuration options:
- Select the Advanced page from the left Select a page panel.
- Configure Event retention mode to control how events are handled under memory pressure.
- Set Maximum dispatch latency to balance real-time processing with system performance.
- Configure Max memory size and Max event size based on your monitoring requirements.
- Select Memory partition mode to optimize for single or multi-CPU environments.
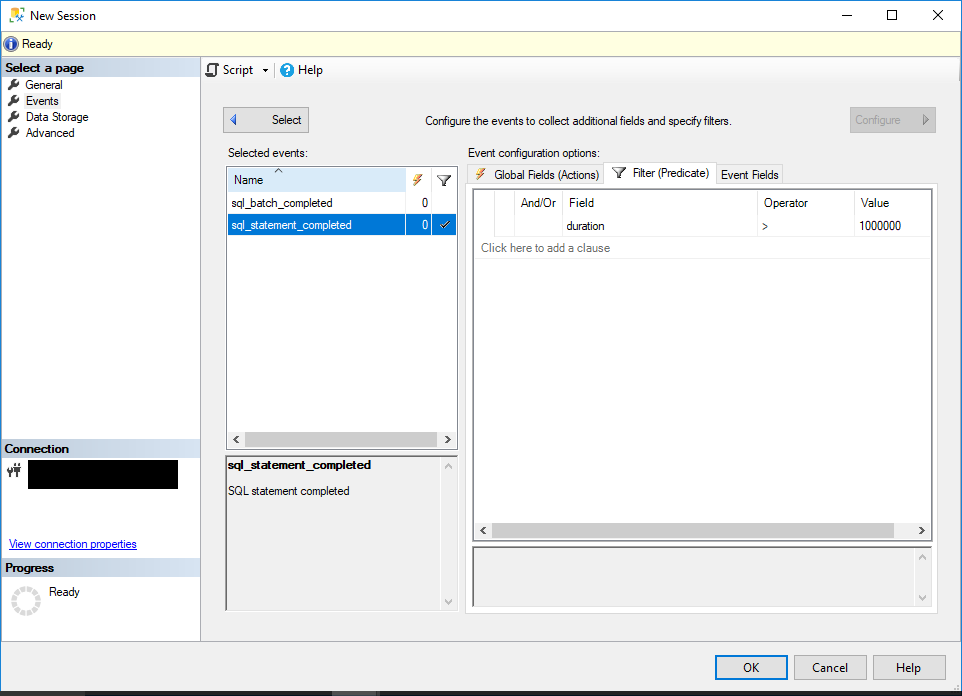
4.4 Configuring Event Filters (Predicates)
Predicates reduce data volume by filtering events based on specific criteria. To configure filters:
- On the Events page, select the event you want to filter, such as “sql_statement_completed”.
- Click Configure to open the event configuration dialog.

- Select the Filter (Predicate) tab.
- In the Field dropdown, choose the field to filter on, such as duration.
- Select an Operator, such as “>”.
- Enter the filter Value, such as 1000000 (1 second).
- Add more conditions if necessary.
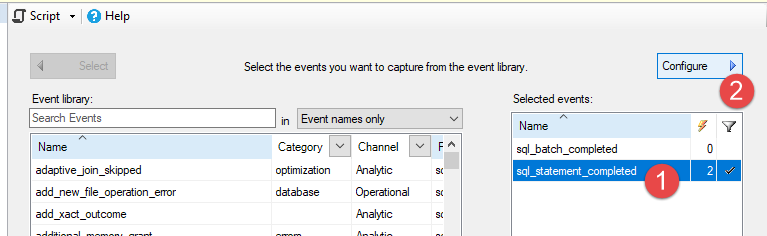
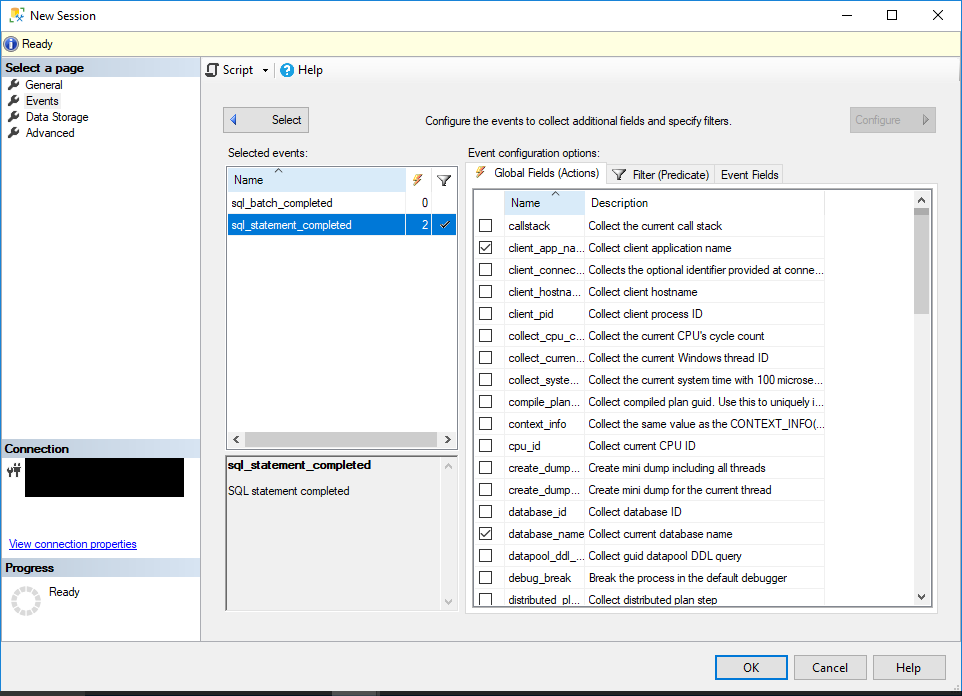
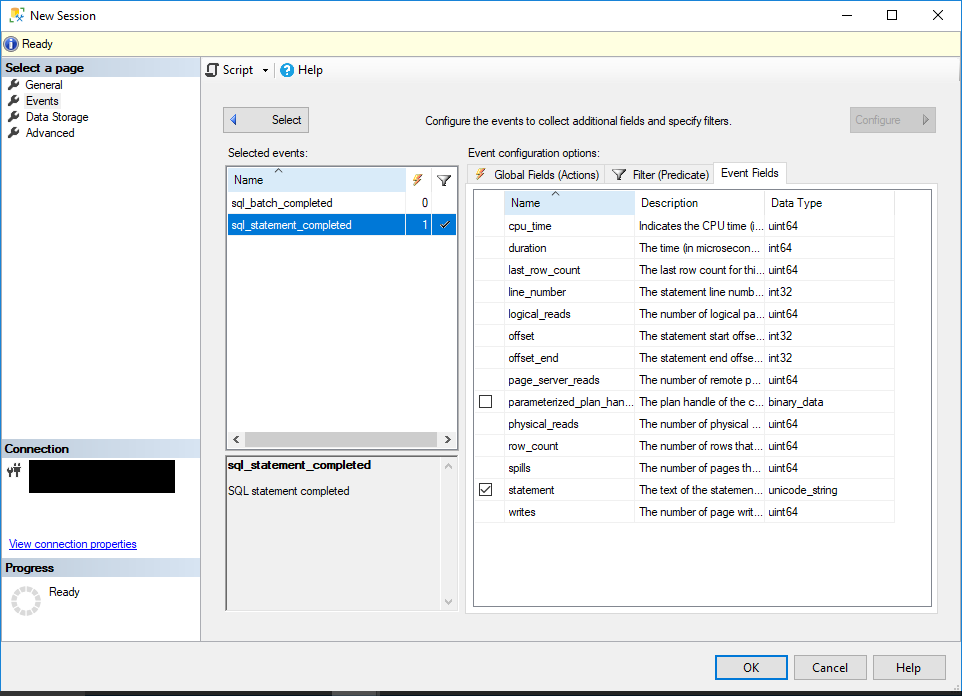
4.5 Selecting Actions and Event Fields
For each event, you can select the data to be collected:
- On the Events page, select the event you want to select the data, such as “sql_statement_completed”.
- Click Configure to open the event configuration dialog.
- Select the Global Fields (Actions) tab.
- Select actions to add supplementary information, such as database_name or client_app_name.

- Review the Event Fields section to see which fields are automatically captured.
- Clear any unnecessary fields to reduce data volume.
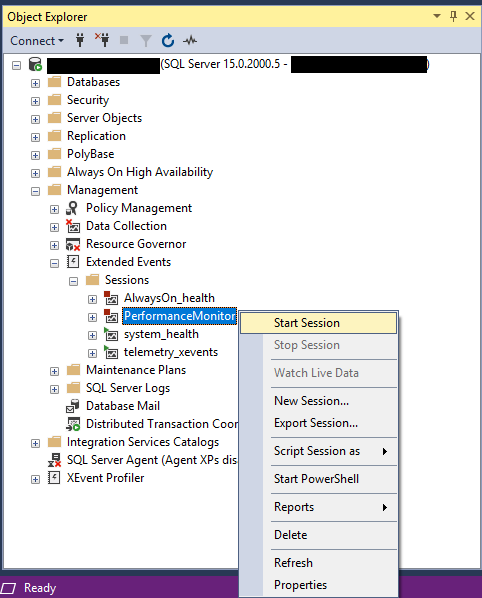
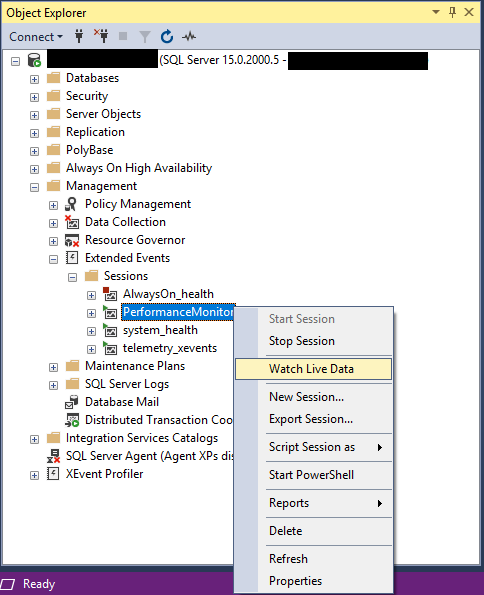
4.6 Starting and Managing Sessions
After configuring your session, you can start it and monitor its operation:
- Click OK to create the session.
- In Object Explorer, expand the Sessions folder to see your new session.
- Right-click the session name and select Start Session to begin capturing events.

- To view live data, right-click the session and select Watch Live Data.

- Stop the session by right-clicking and selecting Stop Session.
5. Creating Extended Event Sessions Using T-SQL
5.1 CREATE EVENT SESSION Syntax
Creating Extended Event sessions with T-SQL provides precise control and enables scripting for automated deployment. The CREATE EVENT SESSION statement follows a specific syntax structure.
The basic syntax includes the session name, ADD EVENT clauses for each event, ADD TARGET clauses for storage destinations, and optional WITH clauses for session configuration.
5.2 Creating a Basic Event Session
A basic session monitors specific events and writes results to a target. Here’s how to construct the essential components.
5.2.1 Defining Session Name and Options
Start by creating the session with a descriptive name:
CREATE EVENT SESSION [SampleSession] ON SERVER
The ON SERVER clause creates a server-scoped session that persists across database changes. For Azure SQL Database, use ON DATABASE for database-scoped sessions.
5.2.2 Adding Events with ADD EVENT
Add events to capture using the ADD EVENT clause:
CREATE EVENT SESSION [SampleSession] ON SERVER
ADD EVENT sqlserver.sql_statement_completed
This captures all completed SQL statements. You can add multiple events by including additional ADD EVENT clauses.
5.2.3 Configuring Event Actions
Actions collect additional context for each event. Add actions within parentheses after the event name:
CREATE EVENT SESSION [SampleSession] ON SERVER
ADD EVENT sqlserver.sql_statement_completed(
    ACTION(sqlserver.sql_text, sqlserver.database_name, sqlserver.username)
)
This example captures the SQL text, database name, and username for each completed statement.
5.2.4 Setting Event Predicates (WHERE Clause)
Predicates filter events to reduce data volume. Use the WHERE clause within the event definition:
CREATE EVENT SESSION [SampleSession] ON SERVER
ADD EVENT sqlserver.sql_statement_completed(
    ACTION(sqlserver.sql_text)
    WHERE ([package0].[greater_than_uint64]([duration],(5000000)))
)
This filters for statements with duration greater than 5 seconds (5,000,000 microseconds).
5.3 Adding Event Targets
Targets define where event data is stored and how it’s processed.
5.3.1 ADD TARGET Syntax
Add targets using the ADD TARGET clause after all events are defined:
ADD TARGET package0.event_file(
    SET filename=N'C:\XEvents\SampleSession.xel'
)
The package0 prefix indicates the target comes from the base package.
5.3.2 Configuring Target Parameters
Each target type accepts specific parameters. For event_file, configure filename, max_file_size, and max_rollover_files:
ADD TARGET package0.event_file(
    SET filename=N'C:\XEvents\SampleSession.xel',
        max_file_size=(50),
        max_rollover_files=(5)
)
This configuration creates files up to 50 MB each, maintaining up to 5 files through rollover.
5.4 Session Options and Settings
The WITH clause configures session-level options that control behavior and resource usage.
5.4.1 MAX_MEMORY and EVENT_RETENTION_MODE
Control memory allocation and event handling under pressure:
WITH (
    MAX_MEMORY=4096 KB,
    EVENT_RETENTION_MODE=ALLOW_SINGLE_EVENT_LOSS
)
EVENT_RETENTION_MODE options include ALLOW_SINGLE_EVENT_LOSS for minimal memory usage, ALLOW_MULTIPLE_EVENT_LOSS for moderate overhead, and NO_EVENT_LOSS for complete data retention at the cost of potential performance impact.
5.4.2 MAX_DISPATCH_LATENCY
Set the maximum time events can remain in buffers before being written to targets:
WITH (
    MAX_DISPATCH_LATENCY=30 SECONDS
)
Lower values provide more real-time data at the cost of increased I/O operations.
5.4.3 MEMORY_PARTITION_MODE
Optimize memory partitioning for your hardware configuration:
WITH (
    MEMORY_PARTITION_MODE=PER_CPU
)
Options include NONE for single partition, PER_NODE for NUMA systems, and PER_CPU for maximum concurrency on multi-CPU systems.
5.5 Starting, Stopping, and Altering Sessions
Manage session state and configuration through ALTER EVENT SESSION statements.
5.5.1 ALTER EVENT SESSION for Start/Stop
Start a session after creation:
ALTER EVENT SESSION [SampleSession] ON SERVER STATE = START;
Stop a running session:
ALTER EVENT SESSION [SampleSession] ON SERVER STATE = STOP;
5.5.2 Modifying Existing Sessions
Modify session configuration while stopped. Add events:
ALTER EVENT SESSION [SampleSession] ON SERVER
ADD EVENT sqlserver.sql_batch_completed;
Remove events:
ALTER EVENT SESSION [SampleSession] ON SERVER
DROP EVENT sqlserver.sql_statement_completed;
5.5.3 Dropping Event Sessions
Remove a session entirely with DROP EVENT SESSION:
DROP EVENT SESSION [SampleSession] ON SERVER;
The session must be stopped before dropping.
6. Working with Event Targets in Detail
6.1 event_file Target Configuration
The event_file target provides persistent storage for event data with flexible configuration options.
6.1.1 File Path and Naming Conventions
Specify the full path and filename for event files:
ADD TARGET package0.event_file(
    SET filename=N'C:\XEvents\MySession.xel'
)
Use .xel extension for Extended Event log files. Ensure the SQL Server service account has write permissions to the specified directory.
6.1.2 File Rollover and Size Management
Configure automatic file rollover to manage disk space:
ADD TARGET package0.event_file(
    SET filename=N'C:\XEvents\MySession.xel',
        max_file_size=(50),
        max_rollover_files=(10)
)
When a file reaches 50 MB, SQL Server Extended Events creates a new file with an incremented suffix. After reaching 10 files, the oldest file is overwritten.
6.1.3 Reading Event File Data
Query event file data using the sys.fn_xe_file_target_read_file function:
SELECT
    event_data,
    file_name,
    file_offset
FROM sys.fn_xe_file_target_read_file(
    'C:\XEvents\MySession*.xel',
    NULL, NULL, NULL
);
The wildcard pattern reads all files associated with the session.
6.2 ring_buffer Target Usage
The ring_buffer target stores events in memory for quick access to recent activity.
6.2.1 Memory-Based Event Storage
Configure ring_buffer for memory-based storage:
ADD TARGET package0.ring_buffer
Events remain accessible only while the session is active and SQL Server is running. Data is lost when the session stops or the server restarts.
6.2.2 Buffer Size and Configuration
Control memory allocation for the ring buffer:
ADD TARGET package0.ring_buffer(
    SET max_memory=(4096)
)
Specify memory in KB. When the buffer fills, older events are discarded using a FIFO approach.
6.2.3 Querying Ring Buffer Data
Access ring buffer data through DMVs:
SELECT
    CAST(target_data AS XML) AS TargetData
FROM sys.dm_xe_session_targets AS t
JOIN sys.dm_xe_sessions AS s
    ON s.address = t.event_session_address
WHERE s.name = 'YourSessionName'
    AND t.target_name = 'ring_buffer';
The target_data contains XML-formatted event information.
6.3 event_counter Target
The event_counter target provides simple counting without detailed data storage:
ADD TARGET package0.event_counter
This target tracks event frequency with minimal overhead, useful for high-volume monitoring where only counts matter.
6.4 histogram Target
The histogram target groups events by field values:
ADD TARGET package0.histogram(
    SET filtering_event_name=N'sqlserver.sql_statement_completed',
        source_type=0,
        source=N'database_name'
)
This configuration creates a histogram showing the distribution of events across databases.
6.5 pair_matching Target
The pair_matching target correlates related events such as lock acquisitions with releases:
ADD TARGET package0.pair_matching(
    SET begin_event=N'sqlserver.lock_acquired',
        end_event=N'sqlserver.lock_released',
        begin_matching_columns=N'resource_type',
        end_matching_columns=N'resource_type'
)
This enables analysis of paired operations and their durations.
7. Viewing and Analyzing Extended Events Data
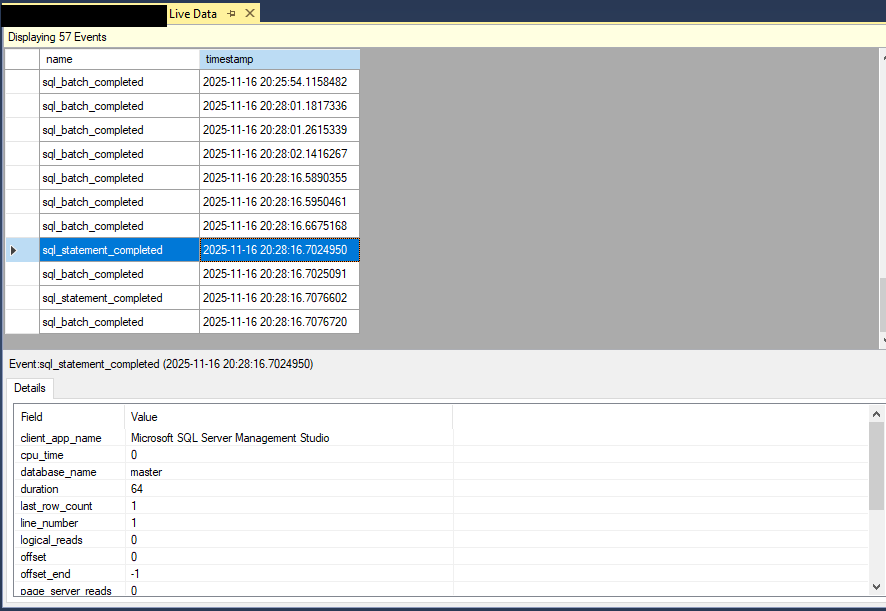
7.1 Using SSMS to View Live Data
SQL Server Management Studio provides a graphical interface for viewing Extended Events data in real-time:
- In Object Explorer, expand Management -> Extended Events -> Sessions.
- Right-click your active session.
- Select Watch Live Data to open the live data viewer.
- Events appear in the grid as they occur.
- Click on individual events to view detailed field values in the details pane.

- Use the toolbar filters to focus on specific event types or field values.
7.2 Querying Event File Data with T-SQL
T-SQL queries provide flexible analysis of captured event data.
7.2.1 sys.fn_xe_file_target_read_file Function
Read event file data using this system function:
SELECT
    object_name AS EventName,
    CAST(event_data AS XML) AS EventData,
    file_name,
    file_offset,
    timestamp_utc
FROM sys.fn_xe_file_target_read_file(
    'C:\XEvents\MySession*.xel',
    NULL, NULL, NULL
);
The function returns one row per event with XML-formatted details.
7.2.2 Parsing XML Event Data
Extract specific values from the XML event data:
SELECT
    event_data.value('(event/@name)[1]', 'VARCHAR(50)') AS EventName,
    event_data.value('(event/@timestamp)[1]', 'DATETIME2') AS Timestamp,
    event_data.value('(event/data[@name="duration"]/value)[1]', 'BIGINT') AS Duration,
    event_data.value('(event/data[@name="statement"]/value)[1]', 'VARCHAR(MAX)') AS Statement
FROM (
    SELECT CAST(event_data AS XML) AS event_data
    FROM sys.fn_xe_file_target_read_file(
        'C:\XEvents\MySession*.xel',
        NULL, NULL, NULL
    )
) AS EventData;
XQuery expressions extract individual field values from the XML structure.
7.2.3 Converting Event Data to Tables
Create structured result sets from event data:
WITH EventData AS (
    SELECT CAST(event_data AS XML) AS EventXML
    FROM sys.fn_xe_file_target_read_file(
        'C:\XEvents\MySession*.xel',
        NULL, NULL, NULL
    )
)
SELECT
    EventXML.value('(event/@name)[1]', 'VARCHAR(100)') AS EventName,
    EventXML.value('(event/data[@name="cpu_time"]/value)[1]', 'BIGINT') AS CPUTime,
    EventXML.value('(event/data[@name="physical_reads"]/value)[1]', 'BIGINT') AS PhysicalReads,
    EventXML.value('(event/action[@name="sql_text"]/value)[1]', 'VARCHAR(MAX)') AS SQLText,
    EventXML.value('(event/action[@name="database_name"]/value)[1]', 'VARCHAR(128)') AS DatabaseName
FROM EventData;
7.3 Querying Ring Buffer Data
Extract data from ring_buffer targets:
SELECT
    n.value('(@name)[1]', 'VARCHAR(50)') AS EventName,
    n.value('(@timestamp)[1]', 'DATETIME2') AS Timestamp,
    n.value('(data[@name="duration"]/value)[1]', 'BIGINT') AS Duration,
    n.value('(action[@name="sql_text"]/value)[1]', 'VARCHAR(MAX)') AS SQLText
FROM (
    SELECT CAST(target_data AS XML) AS TargetData
    FROM sys.dm_xe_session_targets AS t
    JOIN sys.dm_xe_sessions AS s
        ON s.address = t.event_session_address
    WHERE s.name = 'YourSessionName'
        AND t.target_name = 'ring_buffer'
) AS Data
CROSS APPLY TargetData.nodes('//event') AS q(n);
7.4 System Views for Extended Events
SQL Server provides several DMVs and catalog views for managing and monitoring Extended Event sessions.
7.4.1 sys.server_event_sessions
View session definitions stored in the server:
SELECT
    name,
    event_retention_mode_desc,
    max_dispatch_latency,
    max_memory,
    max_event_size,
    memory_partition_mode_desc
FROM sys.server_event_sessions;
This catalog view shows configuration details for all defined sessions.
7.4.2 sys.dm_xe_sessions
View currently active sessions:
SELECT
    name,
    create_time,
    total_regular_buffers,
    regular_buffer_size,
    total_large_buffers,
    large_buffer_size
FROM sys.dm_xe_sessions;
This DMV provides runtime information about active Extended Event sessions.
7.4.3 sys.dm_xe_session_targets
View targets associated with active sessions:
SELECT
    s.name AS SessionName,
    t.target_name,
    t.execution_count,
    t.execution_duration_ms
FROM sys.dm_xe_session_targets AS t
JOIN sys.dm_xe_sessions AS s
    ON s.address = t.event_session_address;
7.4.4 Other Useful DMVs
Additional views provide comprehensive session information:
- sys.dm_xe_session_events: Lists events in active sessions
- sys.dm_xe_session_event_actions: Shows actions configured for session events
- sys.dm_xe_objects: Catalogs all available events, actions, and targets
- sys.dm_xe_object_columns: Details fields available for each event type
- sys.dm_xe_packages: Lists all Extended Event packages
8. Practical Use Cases and Examples
8.1 Monitoring SQL Statement Execution
Tracking SQL statement execution provides insights into query patterns and performance characteristics.
8.1.1 Tracking sql_statement_completed Events
Create a session to monitor completed SQL statements:
CREATE EVENT SESSION [QueryMonitoring] ON SERVER
ADD EVENT sqlserver.sql_statement_completed(
    ACTION(
        sqlserver.sql_text,
        sqlserver.database_name,
        sqlserver.client_hostname,
        sqlserver.username
    )
)
ADD TARGET package0.event_file(
    SET filename=N'C:\XEvents\QueryMonitoring.xel',
        max_file_size=(100),
        max_rollover_files=(5)
)
WITH (
    MAX_MEMORY=4096 KB,
    EVENT_RETENTION_MODE=ALLOW_SINGLE_EVENT_LOSS,
    MAX_DISPATCH_LATENCY=30 SECONDS,
    STARTUP_STATE=OFF
);

ALTER EVENT SESSION [QueryMonitoring] ON SERVER STATE = START;
8.1.2 Filtering by Database or Application
Focus on specific databases or applications using predicates:
CREATE EVENT SESSION [AppSpecificMonitoring] ON SERVER
ADD EVENT sqlserver.sql_statement_completed(
    ACTION(sqlserver.sql_text, sqlserver.client_app_name)
    WHERE (
        [sqlserver].[database_name] = N'YourDatabase'
        AND [sqlserver].[client_app_name] LIKE N'YourApplication%'
    )
)
ADD TARGET package0.event_file(
    SET filename=N'C:\XEvents\AppMonitoring.xel'
);
8.2 Capturing Deadlock Information
Deadlock analysis requires capturing detailed information about conflicting transactions.
8.2.1 xml_deadlock_report Event
Create a session to capture complete deadlock graphs:
CREATE EVENT SESSION [DeadlockMonitoring] ON SERVER
ADD EVENT sqlserver.xml_deadlock_report(
    ACTION(
        sqlserver.database_name,
        sqlserver.sql_text
    )
)
ADD TARGET package0.event_file(
    SET filename=N'C:\XEvents\Deadlocks.xel'
)
WITH (STARTUP_STATE=ON);

ALTER EVENT SESSION [DeadlockMonitoring] ON SERVER STATE = START;
8.2.2 Analyzing Deadlock Graphs
Extract and analyze deadlock information:
SELECT
    EventXML.value('(event/@timestamp)[1]', 'DATETIME2') AS DeadlockTime,
    EventXML.query('.') AS DeadlockGraph
FROM (
    SELECT CAST(event_data AS XML) AS EventXML
    FROM sys.fn_xe_file_target_read_file(
        'C:\XEvents\Deadlocks*.xel',
        NULL, NULL, NULL
    )
) AS EventData
WHERE EventXML.value('(event/@name)[1]', 'VARCHAR(50)') = 'xml_deadlock_report';
The deadlock graph contains details about processes, resources, and victim selection.
8.3 Tracking Query Performance Issues
Identify poorly performing queries using duration and resource consumption metrics.
8.3.1 Long-Running Query Detection
Capture queries exceeding specific duration thresholds:
CREATE EVENT SESSION [LongRunningQueries] ON SERVER
ADD EVENT sqlserver.sql_statement_completed(
    ACTION(
        sqlserver.sql_text,
        sqlserver.database_name,
        sqlserver.plan_handle
    )
    WHERE ([duration] > 5000000)  -- 5 seconds in microseconds
)
ADD TARGET package0.event_file(
    SET filename=N'C:\XEvents\LongQueries.xel'
);
8.3.2 Execution Plan Analysis
Capture query plans for performance analysis:
CREATE EVENT SESSION [QueryPlans] ON SERVER
ADD EVENT sqlserver.query_post_execution_showplan(
    ACTION(
        sqlserver.sql_text,
        sqlserver.database_name
    )
    WHERE ([duration] > 10000000)  -- 10 seconds
)
ADD TARGET package0.event_file(
    SET filename=N'C:\XEvents\QueryPlans.xel',
    max_file_size=(200)
);
8.4 Monitoring Login and Security Events
Track authentication and authorization activities for security auditing.
8.4.1 Login Success and Failure Tracking
Monitor both successful and failed login attempts:
CREATE EVENT SESSION [LoginMonitoring] ON SERVER
ADD EVENT sqlserver.login(
    ACTION(
        sqlserver.client_hostname,
        sqlserver.client_app_name
    )
),
ADD EVENT sqlserver.login_failed(
    ACTION(
        sqlserver.client_hostname
    )
)
ADD TARGET package0.event_file(
    SET filename=N'C:\XEvents\Logins.xel'
)
WITH (STARTUP_STATE=ON);
8.4.2 Permission Changes
Track security permission modifications:
CREATE EVENT SESSION [SecurityChanges] ON SERVER
ADD EVENT sqlserver.server_principal_management_event,
ADD EVENT sqlserver.database_principal_management_event,
ADD EVENT sqlserver.database_permission_change_event
ADD TARGET package0.event_file(
    SET filename=N'C:\XEvents\SecurityAudit.xel'
);
8.5 Database-Level Monitoring
Monitor database-specific operations and state changes.
8.5.1 Backup and Restore Events
Track backup and restore operations:
CREATE EVENT SESSION [BackupMonitoring] ON SERVER
ADD EVENT sqlserver.backup_restore_progress_trace,
ADD EVENT sqlserver.databases_backup_restore_event
ADD TARGET package0.event_file(
    SET filename=N'C:\XEvents\BackupRestore.xel'
);
8.5.2 Database State Changes
Monitor database state transitions:
CREATE EVENT SESSION [DatabaseStateChanges] ON SERVER
ADD EVENT sqlserver.database_started,
ADD EVENT sqlserver.database_stopped
ADD TARGET package0.ring_buffer;
8.6 Detecting Database Corruption and Integrity Issues
SQL Server Extended Events provides early warning capabilities for detecting potential database corruption, allowing proactive intervention before issues escalate.
8.6.1 Key Events for Corruption Detection
Several events signal potential corruption or I/O problems.
8.6.1.1 error_reported Event for Critical Errors
The error_reported event captures all SQL Server errors, including corruption-related error numbers:
ADD EVENT sqlserver.error_reported(
    WHERE (
        [severity] >= (20)
        OR [error_number] IN (823, 824, 825, 832, 855, 856)
    )
)
Error 823 indicates I/O errors, 824 signals logical consistency errors, and 825 reports read-retry successes that may indicate hardware issues.
8.6.1.2 database_suspect_data_page Event
This event fires when SQL Server encounters a suspect page:
ADD EVENT sqlserver.database_suspect_data_page
Suspect pages indicate potential corruption and are recorded in the msdb.dbo.suspect_pages table.
8.6.1.3 errorlog_written Event
Capture entries written to the SQL Server error log:
ADD EVENT sqlserver.errorlog_written(
    WHERE ([severity] >= (16))
)
8.6.2 Creating a Corruption Monitoring Session
Establish a comprehensive session for corruption detection and monitoring.
8.6.2.1 Filtering for Corruption Error Numbers (823, 824, 825)
Create a targeted session focusing on corruption indicators:
CREATE EVENT SESSION [CorruptionDetection] ON SERVER
ADD EVENT sqlserver.error_reported(
    ACTION(
        sqlserver.database_name,
        sqlserver.sql_text
    )
    WHERE (
        [error_number] IN (823, 824, 825, 832, 855, 856)
        OR [severity] >= (20)
    )
),
ADD EVENT sqlserver.database_suspect_data_page(
    ACTION(
        sqlserver.database_name
    )
)
8.6.2.2 Setting Appropriate Severity Levels
Include high-severity errors that may indicate corruption:
WHERE (
    [severity] >= (20)
    OR [error_number] IN (823, 824, 825)
)
Severity 20 and above indicates system-level problems that often relate to corruption.
8.6.2.3 Configuring Event File Target for Alerts
Store corruption events for analysis and alerting:
ADD TARGET package0.event_file(
    SET filename=N'C:\XEvents\CorruptionMonitoring.xel',
        max_file_size=(50),
        max_rollover_files=(10)
)
WITH (
    STARTUP_STATE=ON,
    MAX_DISPATCH_LATENCY=5 SECONDS
);

ALTER EVENT SESSION [CorruptionDetection] ON SERVER STATE = START;
8.6.3 Analyzing Corruption Event Data
Extract and interpret corruption-related events from captured data.
8.6.3.1 Identifying Suspect Pages
Query for database_suspect_data_page events:
SELECT
    EventXML.value('(event/@timestamp)[1]', 'DATETIME2') AS EventTime,
    EventXML.value('(event/data[@name="database_id"]/value)[1]', 'INT') AS DatabaseID,
    EventXML.value('(event/data[@name="file_id"]/value)[1]', 'INT') AS FileID,
    EventXML.value('(event/data[@name="page_id"]/value)[1]', 'BIGINT') AS PageID,
    EventXML.value('(event/action[@name="database_name"]/value)[1]', 'VARCHAR(128)') AS DatabaseName
FROM (
    SELECT CAST(event_data AS XML) AS EventXML
    FROM sys.fn_xe_file_target_read_file(
        'C:\XEvents\CorruptionMonitoring*.xel',
        NULL, NULL, NULL
    )
) AS EventData
WHERE EventXML.value('(event/@name)[1]', 'VARCHAR(50)') = 'database_suspect_data_page';
8.6.3.2 Extracting Error Details and Context
Analyze error_reported events for corruption patterns:
SELECT
    EventXML.value('(event/@timestamp)[1]', 'DATETIME2') AS ErrorTime,
    EventXML.value('(event/data[@name="error_number"]/value)[1]', 'INT') AS ErrorNumber,
    EventXML.value('(event/data[@name="severity"]/value)[1]', 'INT') AS Severity,
    EventXML.value('(event/data[@name="message"]/value)[1]', 'VARCHAR(MAX)') AS ErrorMessage,
    EventXML.value('(event/action[@name="database_name"]/value)[1]', 'VARCHAR(128)') AS DatabaseName,
    EventXML.value('(event/action[@name="sql_text"]/value)[1]', 'VARCHAR(MAX)') AS SQLText
FROM (
    SELECT CAST(event_data AS XML) AS EventXML
    FROM sys.fn_xe_file_target_read_file(
        'C:\XEvents\CorruptionMonitoring*.xel',
        NULL, NULL, NULL
    )
) AS EventData
WHERE EventXML.value('(event/@name)[1]', 'VARCHAR(50)') = 'error_reported'
    AND EventXML.value('(event/data[@name="error_number"]/value)[1]', 'INT') IN (823, 824, 825);
8.6.4 Integration with DBCC CHECKDB
Use Extended Events data to guide DBCC CHECKDB execution.
8.6.4.1 Triggering DBCC CHECKDB Based on Events
When corruption events are detected, execute DBCC CHECKDB for comprehensive validation:
-- After detecting corruption events, run DBCC CHECKDB
DBCC CHECKDB ('YourDatabaseName') WITH NO_INFOMSGS, ALL_ERRORMSGS;
Extended Events provides the early warning, while DBCC CHECKDB performs thorough validation.
8.6.4.2 Automated Corruption Response Workflows
Implement automated responses by monitoring the event file:
- Configure SQL Server Agent job to periodically query the corruption monitoring event file.
- When corruption events are found, execute DBCC CHECKDB on the affected database.
- Send email alerts to DBAs with event details and DBCC CHECKDB results.
- Log findings to a centralized monitoring table for trend analysis.
8.6.4.3 Balancing Proactive Monitoring with Performance
Extended Events offers low-overhead corruption detection compared to frequent DBCC CHECKDB execution:
- Run Extended Events continuously for real-time corruption detection
- Execute DBCC CHECKDB only when corruption indicators appear
- Schedule regular DBCC CHECKDB during maintenance windows
- Use Extended Events to identify which databases require immediate attention
This approach provides proactive monitoring without the significant resource consumption of constant integrity checks.
8.6.4.4 Repair Corrupt Database
If corruptions are detected in the database, you can use DBCC CHECKDB fix minor corruptions. If it fails, you can try a third-party SQL database recovery tool, which generally offers a higher recovery rate on severely corrupt databases.
9. Server-Scoped vs Database-Scoped Extended Events
9.1 Server-Scoped Event Sessions
Server-scoped sessions monitor activity across the entire SQL Server instance. These sessions are created with the ON SERVER clause and persist in the master database.
CREATE EVENT SESSION [ServerWideMonitoring] ON SERVER
ADD EVENT sqlserver.sql_statement_completed
ADD TARGET package0.event_file(
    SET filename=N'C:\XEvents\ServerWide.xel'
);
Server-scoped sessions capture events from all databases and are suitable for instance-level monitoring.
9.2 Database-Scoped Event Sessions (Azure SQL Database)
Database-scoped sessions are limited to a single database and are primarily used in Azure SQL Database where server-level access is restricted:
CREATE EVENT SESSION [DatabaseSpecificMonitoring] ON DATABASE
ADD EVENT sqlserver.sql_statement_completed
ADD TARGET package0.event_file(
    SET filename=N'DatabaseMonitoring.xel'
);
In Azure SQL Database, event files are stored in Azure Blob Storage rather than local file systems.
9.3 Differences and Use Cases
Server-scoped sessions provide comprehensive monitoring across all databases but require elevated permissions. Database-scoped sessions offer isolation and are appropriate when monitoring specific applications or tenants.
Use server-scoped sessions for centralized monitoring, performance troubleshooting across databases, and security auditing. Use database-scoped sessions in Azure SQL Database, multi-tenant environments, or when delegating monitoring responsibilities to application teams.
10. Extended Events in Azure SQL Database
10.1 Azure-Specific Considerations
Azure SQL Database implements Extended Events with some differences from on-premises SQL Server. Sessions are database-scoped by default, and event file storage uses Azure Blob Storage rather than local file systems.
Authentication to Azure Blob Storage requires a SAS token configured within the event file target. Connection strings reference the storage account and container where event files are stored.
10.2 Available Targets in Azure
Azure SQL Database supports these Extended Event targets:
- event_file: Writes to Azure Blob Storage
- ring_buffer: Memory-based storage with the same behavior as on-premises
- event_counter: Counts event occurrences
The event_file target requires configuration with Azure Blob Storage credentials:
ADD TARGET package0.event_file(
    SET filename=N'https://yourstorageaccount.blob.core.windows.net/container/EventFile.xel'
)
10.3 Creating Database-Scoped Sessions
Create a session in Azure SQL Database:
CREATE EVENT SESSION [AzureMonitoring] ON DATABASE
ADD EVENT sqlserver.sql_statement_completed(
    ACTION(sqlserver.sql_text, sqlserver.database_name)
)
ADD TARGET package0.ring_buffer
WITH (MAX_MEMORY=4096 KB);

ALTER EVENT SESSION [AzureMonitoring] ON DATABASE STATE = START;
Database-scoped sessions in Azure behave similarly to server-scoped sessions on-premises but with scope limited to the current database.
11. Best Practices and Performance Optimization
11.1 Minimizing Performance Impact
Extended Events are designed for minimal overhead, but improper configuration can impact performance. Follow these guidelines:
- Use specific predicates to filter events rather than capturing everything
- Avoid collecting unnecessary actions that add processing overhead
- Choose appropriate targets based on data retention needs
- Set reasonable buffer sizes and dispatch latencies
- Monitor session resource consumption using DMVs
11.2 Choosing the Right Events and Filters
Select events that directly address your monitoring objectives. Avoid high-frequency events unless necessary, and always apply predicates to reduce data volume.
For example, instead of capturing all sql_statement_completed events, filter for specific databases or duration thresholds:
WHERE (
    [sqlserver].[database_name] = N'ProductionDB'
    AND [duration] > 1000000
)
11.3 Target Selection Guidelines
Choose targets based on your analysis requirements:
- Use event_file for detailed historical analysis and long-term retention
- Use ring_buffer for real-time monitoring with minimal I/O impact
- Use event_counter when only frequency matters
- Use histogram for distribution analysis
- Use pair_matching for correlated event analysis
11.4 Session Configuration Recommendations
Configure sessions with appropriate resource limits:
- Set MAX_MEMORY based on expected event volume and server resources
- Use ALLOW_SINGLE_EVENT_LOSS for minimal overhead in most scenarios
- Set MAX_DISPATCH_LATENCY to balance real-time needs with performance
- Use PER_CPU memory partitioning on multi-processor systems
- Avoid STARTUP_STATE=ON unless continuous monitoring is required
11.5 Managing Event File Size and Retention
Configure file rollover to prevent unbounded disk usage:
ADD TARGET package0.event_file(
    SET filename=N'C:\XEvents\Session.xel',
        max_file_size=(100),
        max_rollover_files=(10)
)
This configuration maintains approximately 1 GB of event data (10 files × 100 MB). Adjust based on your retention requirements and available storage.
12. Troubleshooting Extended Events
12.1 Common Issues and Solutions
Common Extended Events issues include sessions not capturing data, performance degradation, file target problems, and unexpected session behavior.
12.2 Session Not Capturing Data
If a session is not capturing expected events:
- Verify the session is started using sys.dm_xe_sessions.
- Check predicates to ensure they don’t filter out all events.
- Confirm events are firing by temporarily removing filters.
- Review permissions to ensure you have access to view session data.
- Check that target configuration is correct and writable.
SELECT name, create_time
FROM sys.dm_xe_sessions
WHERE name = 'YourSessionName';
12.3 Performance Degradation
If Extended Events cause performance issues:
- Add predicates to reduce event volume.
- Remove unnecessary actions that collect supplementary data.
- Increase MAX_DISPATCH_LATENCY to reduce write frequency.
- Change EVENT_RETENTION_MODE to ALLOW_SINGLE_EVENT_LOSS.
- Consider using ring_buffer instead of event_file for high-frequency events.
12.4 File Target Issues
File target problems often relate to permissions or disk space:
- Verify the SQL Server service account has write permissions to the target directory.
- Ensure sufficient disk space is available.
- Check that the specified path exists and is accessible.
- Review file rollover configuration if files are not rolling over as expected.
12.5 Debugging with System Views
Use DMVs to diagnose Extended Events issues:
-- Check session status
SELECT s.name, s.create_time, s.total_regular_buffers, s.total_large_buffers
FROM sys.dm_xe_sessions AS s;

-- View session targets and their status
SELECT
    s.name AS SessionName,
    t.target_name,
    t.execution_count,
    CAST(t.target_data AS XML) AS TargetData
FROM sys.dm_xe_session_targets AS t
JOIN sys.dm_xe_sessions AS s
    ON s.address = t.event_session_address;

-- Check for dropped events
SELECT s.name, s.dropped_event_count, s.dropped_buffer_count
FROM sys.dm_xe_sessions AS s;
13. Advanced Topics
13.1 Creating Custom Event Packages
Advanced users can create custom event packages to extend SQL Server Extended Events functionality. This requires C++ development and integration with the SQL Server extensibility framework.
Custom packages enable monitoring of application-specific events or integrating third-party monitoring systems with Extended Events infrastructure.
13.2 Event Session Templates
SSMS provides built-in templates for common monitoring scenarios. Access templates when creating new sessions through the wizard:
- In the New Session dialog, click the Template dropdown.
- Select from available templates like Query Detail Tracking or System Health.
- Modify the template to suit your specific requirements.
13.3 Integrating with Monitoring Solutions
Extended Events data can feed enterprise monitoring solutions:
- Export event data to centralized logging systems
- Parse event files and load data into monitoring databases
- Create custom dashboards using BI tools
- Trigger alerts based on specific event patterns
- Correlate SQL Server events with application and infrastructure metrics
13.4 Automation and Scheduling
Automate Extended Events management using SQL Server Agent:
- Create jobs to start/stop sessions during specific time windows
- Schedule event file analysis and reporting
- Implement data retention policies by archiving or deleting old event files
- Automate response to detected conditions such as performance issues or security events
14. Migration from SQL Server Profiler
14.1 SQL Server Profiler Events to Extended Events Mapping
Microsoft provides mapping between SQL Server Profiler events and Extended Events. Common mappings include:
- SQL:BatchCompleted -> sql_batch_completed
- SQL:BatchStarting -> sql_batch_starting
- SQL:StmtCompleted -> sql_statement_completed
- SQL:StmtStarting -> sql_statement_starting
- Deadlock Graph -> xml_deadlock_report
- Audit Login -> login
- Audit Logout -> logout
14.2 Converting Trace Definitions
Convert existing SQL Server Profiler traces to Extended Events sessions by identifying equivalent events and configuring appropriate predicates. SSMS provides assistance for common conversions.
Review trace filters and convert them to Extended Events predicates. Actions in Extended Events replace trace columns from SQL Server Profiler.
14.3 Performance Comparison
Extended Events provide significantly better performance than SQL Server Profiler. Benchmark studies show Extended Events consume fewer CPU cycles and have less impact on transaction throughput.
Extended Events use asynchronous processing and optimized memory management, while SQL Server Profiler relies on synchronous event capture that blocks until trace processing completes.
15. Conclusion
15.1 Summary of Key Concepts
SQL Server Extended Events provides a powerful, lightweight framework for monitoring and troubleshooting SQL Server. The architecture consists of events, actions, predicates, targets, and sessions that work together to capture relevant server activity.
Sessions can be created using SSMS or T-SQL, offering flexibility for both ad-hoc troubleshooting and automated monitoring. Multiple target types support different analysis approaches, from real-time monitoring with ring_buffer to historical analysis with event_file.
Extended Events delivers superior performance compared to SQL Server Profiler while providing more comprehensive monitoring capabilities. The system enables database administrators and developers to diagnose issues, optimize performance, enhance security, and maintain compliance.
15.2 Next Steps and Further Resources
To continue developing your SQL Server XEvents expertise:
- Implement Extended Events in test environments to gain hands-on experience
- Review Microsoft documentation for complete event catalogs and detailed syntax reference
- Join SQL Server community forums to learn from others’ experiences
- Explore advanced scenarios like custom packages and integration with monitoring platforms
- Develop a library of session templates for common monitoring scenarios
16 FAQ Section
Q: What are SQL Server Extended Events?
A: SQL Server Extended Events is a lightweight performance monitoring system integrated into the SQL Server Database Engine that captures detailed information about server operations with minimal overhead.
Q: How do Extended Events differ from SQL Server Profiler?
A: Extended Events provide better performance, lower overhead, and more flexible configuration than SQL Server Profiler. SQL Server Profiler is deprecated, and Microsoft recommends using Extended Events for all monitoring tasks.
Q: Can Extended Events impact SQL Server performance?
A: When properly configured with appropriate predicates and resource limits, Extended Events have minimal performance impact. Poor configuration without filtering can affect performance.
Q: What permissions are required to create Extended Event sessions?
A: You need ALTER ANY EVENT SESSION permission for server-scoped sessions or CONTROL permission on the database for database-scoped sessions.
Q: How do I view Extended Events data?
A: Use SQL Server Management Studio’s live data viewer, query event files with sys.fn_xe_file_target_read_file, or query ring buffer data through DMVs.
Q: Can Extended Events detect database corruption?
A: Yes, Extended Events can capture corruption-related errors (823, 824, 825) and suspect page events, providing early warning for potential corruption issues.
Q: What is the difference between events, actions, and predicates?
A: Events are occurrences you want to monitor. Actions add supplementary information to captured events. Predicates filter events based on conditions to reduce data volume.
Q: How do I monitor queries from specific applications or databases?
A: Use predicates in your event configuration to filter by database_name, client_app_name, or other relevant fields.
Q: What targets should I use for Extended Events?
A: Use event_file for persistent storage and historical analysis, ring_buffer for real-time monitoring with low overhead, event_counter for simple frequency tracking, and histogram for distribution analysis.
Q: Are Extended Events available in Azure SQL Database?
A: Yes, Azure SQL Database supports database-scoped Extended Events with event files stored in Azure Blob Storage.
Q: How do I troubleshoot an Extended Events session that’s not capturing data?
A: Verify the session is started, check predicates aren’t filtering all events, confirm target configuration, and review permissions using system DMVs.
Q: Can I automate Extended Events management?
A: Yes, use SQL Server Agent jobs to start/stop sessions, analyze event files, implement retention policies, and respond to detected conditions.
References
- Quick Start: Extended Events in SQL Server – Microsoft Learn
- Extended Events Overview – Microsoft Learn
- SQL Server Extended Events Sessions – Microsoft Learn
- Targets for Extended Events in SQL Server – Microsoft Learn
- SQL Server Extended Events Engine – Microsoft Learn
- SQL Server Profiler: Complete Guide
- DBCC CHECKDB: Complete Guide
- DataNumen SQL Recovery
About the Author
Yuan Sheng is a senior database administrator (DBA) with over 10 years of experience in SQL Server environments and enterprise database management. He has successfully resolved hundreds of database recovery scenarios across financial services, healthcare, and manufacturing organizations.
Yuan specializes in SQL Server database recovery, high availability solutions, and performance optimization. His extensive hands-on experience includes managing multi-terabyte databases, implementing Always On Availability Groups, and developing automated backup and recovery strategies for mission-critical business systems.
Through his technical expertise and practical approach, Yuan focuses on creating comprehensive guides that help database administrators and IT professionals solve complex SQL Server challenges efficiently. He stays current with the latest SQL Server releases and Microsoft’s evolving database technologies, regularly testing recovery scenarios to ensure his recommendations reflect real-world best practices.
Have questions about SQL Server recovery or need additional database troubleshooting guidance? Yuan welcomes feedback and suggestions for improving these technical resources.