1. Introduction
1.1 What is SQL Server Activity Monitor?
SQL Server Activity Monitor is a built-in diagnostic tool within SQL Server Management Studio that displays information about SQL Server processes and their effect on server performance. It allows you to track SQL Server processes, monitor resource waits, analyze expensive queries, and observe I/O patterns—all from a single interface.
1.2 Why Use SQL Server Activity Monitor?
Activity Monitor serves as your first line of defense when troubleshooting performance problems. It provides immediate visibility into what’s happening on your SQL Server instance without requiring complex T-SQL queries or third-party tools.
The tool excels at helping you quickly identify common issues such as blocking sessions, CPU-intensive queries, excessive query executions, and I/O bottlenecks. When users report that an application is slow or unresponsive, Activity Monitor helps you determine whether the database server is the culprit.
For database administrators who don’t work with SQL Server daily, Activity Monitor offers an accessible entry point for understanding server activity. Even experienced DBAs use it as their starting point for performance investigations.
1.3 Activity Monitor vs Other Monitoring Tools
While Activity Monitor is valuable, it’s important to understand how it compares to other monitoring options:
Activity Monitor vs sp_WhoIsActive: Activity Monitor provides a graphical interface with multiple panes, while sp_WhoIsActive is a comprehensive stored procedure that offers more detailed information in a single result set. sp_WhoIsActive shows specific wait types that Activity Monitor groups together and provides more granular blocking information.
Activity Monitor vs sp_who2: The traditional sp_who2 command shows basic session information, but Activity Monitor goes further by displaying wait statistics, expensive queries, and I/O metrics in an organized, visual format.
Activity Monitor vs Third-Party Tools: Commercial monitoring solutions like SolarWinds Database Performance Analyzer offer historical tracking, alerting, and advanced analytics that Activity Monitor lacks. However, Activity Monitor requires no additional cost or installation.
1.4 Key Benefits for Database Administrators
Activity Monitor offers several advantages that make it an essential DBA tool:
- Zero Cost: As a built-in SQL Server Management Studio feature, there’s no licensing fee or deployment effort required.
- Real-Time Monitoring: See current server activity as it happens, with configurable refresh intervals from 1 second to 1 hour.
- Integrated Actions: Right-click on processes to kill sessions, view query details, or launch SQL Server Profiler traces—all from within the tool.
- Multiple Perspectives: View server health from different angles through five specialized panes, each focusing on specific aspects of performance.
- Quick Troubleshooting: Identify the most common performance problems within minutes, accelerating your mean time to resolution.
- Low Barrier to Entry: No advanced knowledge required to begin using the tool effectively, though deeper SQL Server expertise helps with interpretation.
2. Getting Started with Activity Monitor
Before you can leverage Activity Monitor effectively, you need to understand the prerequisites, required permissions, and various methods for launching the tool.
2.1 Prerequisites and System Requirements
To use SQL Server Activity Monitor, you need SQL Server Management Studio (SSMS) installed on your local machine or a jump server. The Activity Monitor tool was significantly redesigned in SQL Server 2008, so the information in this guide applies to SQL Server 2008 and later versions.
You must have network connectivity to the SQL Server instance you want to monitor. For cloud-hosted databases, you’ll typically need a VPN connection or properly configured firewall rules to access the instance.
Activity Monitor works with all editions of SQL Server, including Express, Standard, and Enterprise. The tool itself runs on your client machine within SSMS, so the server’s resources are only impacted by the monitoring queries it executes.
2.2 Required Permissions
Proper permissions are essential for Activity Monitor to function correctly. Without the appropriate rights, you may see a blank display or receive access denied errors.
2.2.1 VIEW SERVER STATE Permission
The VIEW SERVER STATE permission is the primary requirement for using Activity Monitor. This server-level permission allows you to see all active processes and their associated metrics.
To grant this permission, a server administrator can execute:
GRANT VIEW SERVER STATE TO [YourLoginName];
Without VIEW SERVER STATE, Activity Monitor may open but display no data in any of its panes.
2.2.2 Database-Level Permissions
To view information in the Data File I/O pane, you need additional permissions. Specifically, you must have one of the following combinations:
- CREATE DATABASE permission, or
- ALTER ANY DATABASE permission, or
- VIEW ANY DEFINITION permission
These permissions must be combined with VIEW SERVER STATE for full Activity Monitor functionality.
2.2.3 Permission Troubleshooting
If Activity Monitor opens but shows no data, permissions are the most common cause. Check that your login has VIEW SERVER STATE granted at the server level. You can verify your permissions by running:
SELECT * FROM fn_my_permissions(NULL, 'SERVER');
Look for ‘VIEW SERVER STATE’ in the permission_name column. If it’s missing, contact your database administrator to have it granted.
2.3 How to Open Activity Monitor in SSMS
SQL Server Management Studio provides four different methods to launch Activity Monitor, giving you flexibility based on your workflow preferences.
2.3.1 Method 1: From the Toolbar
The quickest way to open Activity Monitor is using the toolbar icon:
- Connect to your SQL Server instance in SQL Server Management Studio.
- Locate the Activity Monitor icon in the standard toolbar (it resembles a bar chart with a green play button).
- Click the icon to launch Activity Monitor.
![]()
This method is fastest when you’re already working in SSMS and need to quickly check server activity.
2.3.2 Method 2: From Object Explorer
You can also launch Activity Monitor directly from the Object Explorer:
- In Object Explorer, locate the SQL Server instance you want to monitor.
- Right-click on the instance name.
- Select Activity Monitor from the context menu.
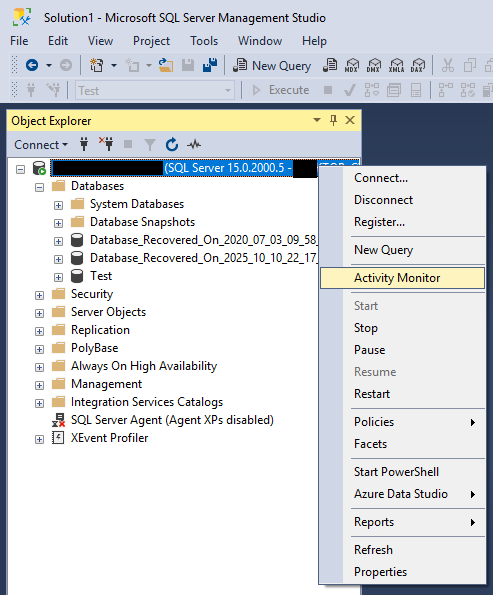
This method is useful when connecting to multiple servers, as it ensures you’re monitoring the correct instance.
2.3.3 Method 3: Using Keyboard Shortcut
For keyboard-focused users, SQL Server Management Studio provides a dedicated shortcut:
- Ensure SSMS is the active window and you’re connected to an instance.
- Press Ctrl + Alt + A.
- Activity Monitor will open for the currently selected instance in Object Explorer.
Note that Activity Monitor will connect to whichever server instance you have selected in Object Explorer, so ensure you’ve selected the correct instance before using this shortcut.
2.3.4 Method 4: From Options Menu (Startup Configuration)
If you frequently use Activity Monitor, you can configure SSMS to launch it automatically whenever you start the application:
- In SQL Server Management Studio, navigate to Tools -> Options.
- In the Options dialog box, expand Environment, and then select Startup.
- From the At startup dropdown list, select Open Object Explorer and Activity Monitor.
- Select OK.
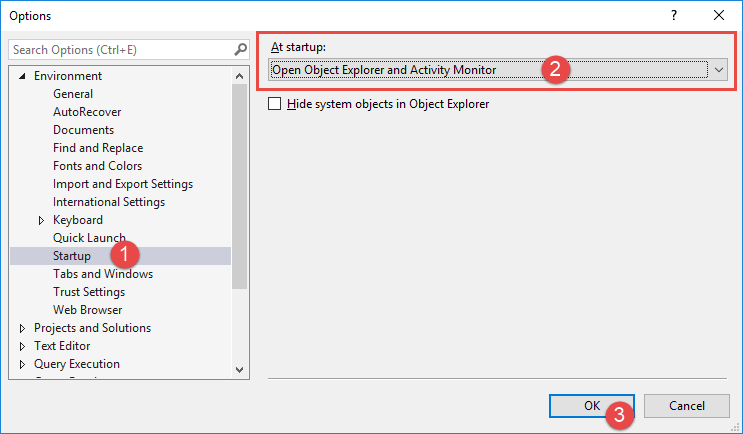
The next time you launch SSMS and connect to a server, Activity Monitor will open automatically alongside Object Explorer.
3. Understanding Activity Monitor Panes
Activity Monitor organizes information into five expandable panes, each providing a different perspective on server activity. Understanding what each pane displays is crucial for effective troubleshooting.
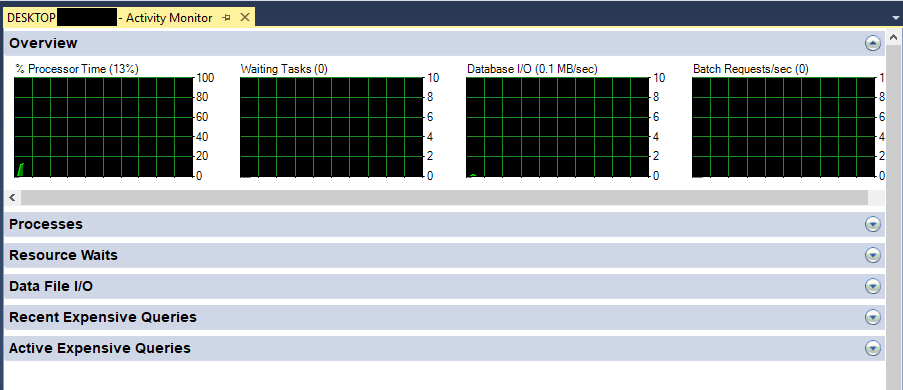
3.1 Overview Pane
The Overview pane presents four real-time graphs that give you a quick health snapshot of your SQL Server instance. These graphs update at a configurable interval and help you identify abnormal patterns at a glance.
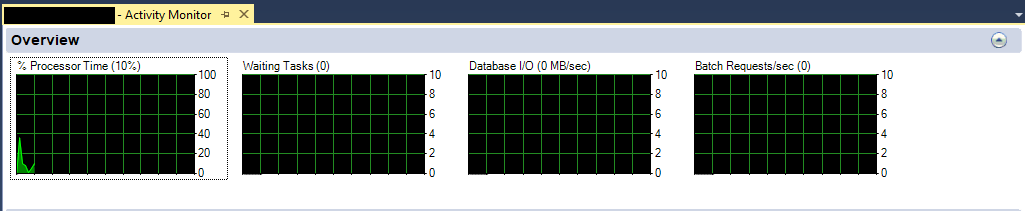
3.1.1 % Processor Time
This graph shows the percentage of time the processor spends executing non-idle threads for the SQL Server instance across all CPUs. The value represents SQL Server’s processor utilization, not the entire server’s CPU usage.
If you consistently see processor time at or near 100%, your server is CPU-bound. This could indicate inefficient queries, missing indexes, or insufficient hardware capacity. Use the Recent Expensive Queries pane to identify which queries are consuming the most CPU.
3.1.2 Waiting Tasks
This metric displays the number of tasks that are waiting for resources to be released before they can proceed. Tasks may wait for CPU, I/O, memory, or locks.
A consistently high number of waiting tasks indicates resource contention. The Resource Waits pane provides more detail about what types of resources are causing waits.
3.1.3 Database I/O (MB/s)
This graph shows the rate of data transfer between memory and disk. It combines both reads and writes, measured in megabytes per second.
Spikes in database I/O can indicate queries performing large table scans, excessive logging activity, or checkpoint operations. The Data File I/O pane breaks down I/O activity by database and file.
3.1.4 Batch Requests/sec
This metric represents the number of SQL Server batches received by the instance per second. A batch can be a single statement or multiple statements submitted together.
This value gives you a sense of overall server activity. Sudden drops in batch requests during normal business hours may indicate application connectivity issues or user-facing problems.
3.1.5 Setting Refresh Intervals
You can customize how frequently Activity Monitor updates its data:
- Right-click anywhere in the Overview pane.
- Select Refresh Interval.
- Choose an interval from the predefined values: 1 second, 5 seconds, 10 seconds (default), 30 seconds, 1 minute, or 1 hour.
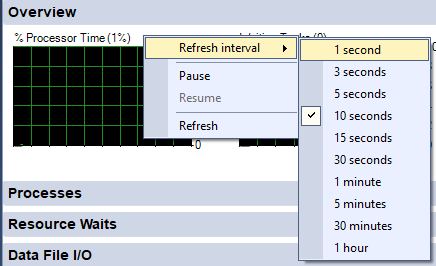
Setting refresh intervals below 10 seconds increases the monitoring overhead on your server. For production systems under heavy load, consider using 30 seconds or longer intervals to minimize impact.
3.2 Processes Pane
The Processes pane displays information about currently running sessions on your SQL Server instance. This pane is essential for identifying who is doing what and spotting blocking issues.

3.2.1 Understanding Process Information
Each row in the Processes pane represents an active session on the server. The pane shows sessions from all databases and all users, giving you a comprehensive view of server activity.
The information displayed includes the login name, application name, hostname, database being accessed, and current command. This helps you correlate database activity with specific users or applications.
3.2.2 Key Columns Explained
Understanding the key columns helps you interpret process information effectively:
- Session ID: A unique identifier for each connection. System processes use negative session IDs.
- User Process: Indicates whether this is a user session (Yes) or a system process (No).
- Login: The SQL Server login or Windows account associated with the session.
- Database: The current database context for the session.
- Task State: Shows what the session is currently doing (RUNNING, SUSPENDED, SLEEPING, etc.).
- Command: The type of command being executed (SELECT, INSERT, UPDATE, etc.).
- Application: The name of the application that created the connection.
- Wait Time: How long (in milliseconds) the session has been waiting for resources.
- Wait Type: The specific type of resource the session is waiting for.
- CPU Time: Total CPU time consumed by this session since it connected.
- Memory Use: Amount of memory (in KB) currently allocated to the session.
3.2.3 Filtering and Sorting Processes
The Processes pane includes powerful filtering capabilities to help you focus on relevant sessions:
- Click the dropdown arrow in any column header.
- The filter shows available values for that column, including All, Blanks, and NonBlanks.
- Select specific values to filter the display to only those sessions.
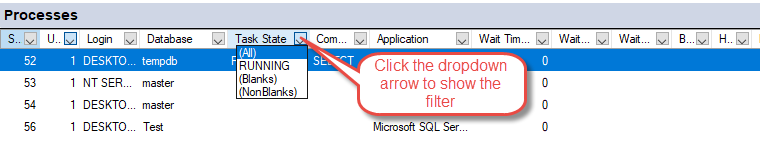
For example, you can filter Task State to show only RUNNING sessions, or filter Database to see activity against a specific database.
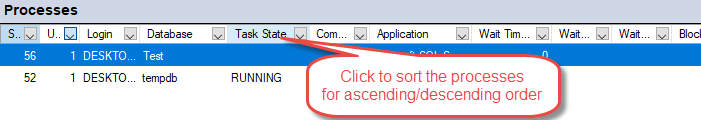
You can also sort by any column by clicking its header. Click once for ascending order, twice for descending order.
3.2.4 Identifying Blocking and Blocked Sessions
The Processes pane helps you identify blocking scenarios where one session prevents others from proceeding:
- Blocked By: Shows the Session ID of the session that is blocking this session. If this column contains a value, the session is waiting for a lock held by another session.
- Head Blocker: Displays ‘1’ if this session is blocking others but is not itself blocked. This is the root cause of a blocking chain.
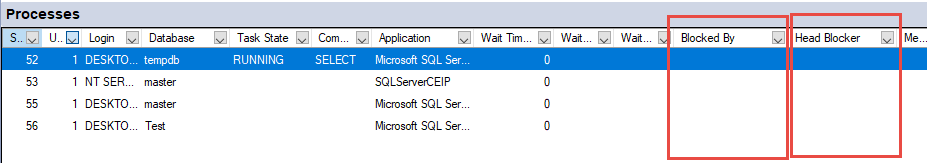
To investigate a blocking issue, first identify the head blocker (the session marked with ‘1’ in the Head Blocker column), then examine what it’s doing and decide whether to let it complete or terminate it.
3.2.5 Process Actions (Kill, Details, Trace)
Activity Monitor allows you to take actions on individual sessions:
- Right-click on any session in the Processes pane.
- You’ll see several options:
- Details: Shows the last command executed by this session.
- Kill Process: Terminates the session (use with caution).
- Trace Process in SQL Server Profiler: Launches SQL Server Profiler and automatically filters to show only activity from this session.
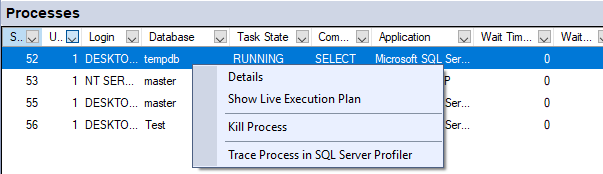
The Details option shows you the command text, but note that this is the last command executed—it may not still be running. The Trace option is particularly useful when you need to see the complete sequence of commands a session is executing.
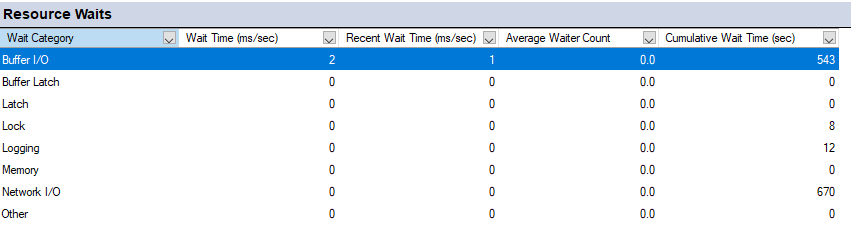
3.3 Resource Waits Pane
The Resource Waits pane summarizes wait statistics, showing what types of resources sessions are waiting for most frequently. This information is crucial for diagnosing performance bottlenecks.
3.3.1 Understanding Wait Statistics
When SQL Server cannot immediately grant a resource request (such as a lock, CPU time, or memory), the requesting task enters a wait state. Wait statistics track these waiting periods and help you understand where the server is spending time waiting rather than working.
The Resource Waits pane collects data from system dynamic management views like sys.dm_os_wait_stats and sys.dm_exec_requests. At each refresh interval, it calculates the difference between the current and previous snapshot, showing you the rate of accumulation for each wait type.
3.3.2 Wait Categories
Activity Monitor groups hundreds of individual wait types into broader categories to simplify interpretation:
- CPU: Tasks waiting for CPU time to become available.
- Buffer Latch: Waits for short-term synchronization objects protecting access to data pages in memory. This category includes page latch waits (PAGELATCH_*).
- Lock: Waits caused by sessions holding locks that other sessions need.
- Memory: Waits for memory grants needed by operations like sorting and hashing.
- Network I/O: Waits sending data to or receiving data from clients.
- SQL CLR: Waits related to Common Language Runtime execution.
While this grouping simplifies the view, it also obscures important details. For example, “Buffer Latch” might group together PAGELATCH_SH, PAGELATCH_UP, and PAGELATCH_EX waits, which have different implications for performance.
3.3.3 Interpreting Wait Time and Wait Tasks
The Resource Waits pane displays two key metrics for each wait category:
- Cumulative Wait Time (ms): The total milliseconds accumulated during the current refresh interval for this wait category.
- Waiting Tasks: The number of tasks currently waiting for resources in this category.
The wait time value is particularly interesting. If you have a 10-second refresh interval and see 20,000ms of wait time for a category, that indicates multiple concurrent waits (20,000ms / 10,000ms = average of 2 concurrent waits during the interval).
3.3.4 Identifying Performance Bottlenecks
Use the Resource Waits pane to identify where your server is spending the most time waiting:
- Expand the Resource Waits pane.
- Observe the wait categories accumulating the highest wait times.
- Sort by Cumulative Wait Time to see which resources are most constrained.
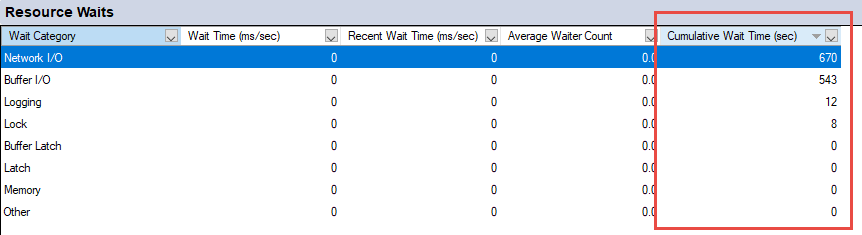
High Buffer Latch waits often indicate contention for data pages in memory, which might suggest I/O bottlenecks or tempdb contention. High Lock waits point to blocking issues. High Memory waits suggest insufficient memory grants for query operations.
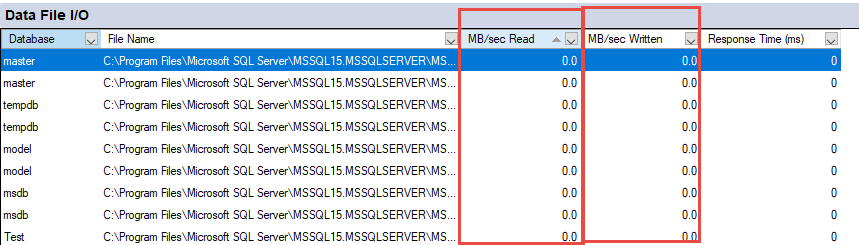
3.4 Data File I/O Pane
The Data File I/O pane shows disk activity for each database file on your server, helping you identify I/O bottlenecks and understand disk utilization patterns.
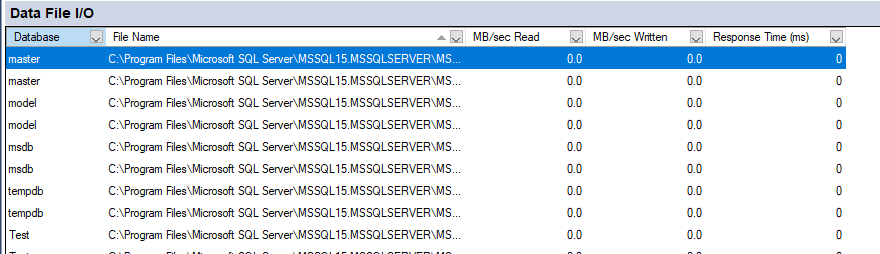
3.4.1 Understanding I/O Metrics
The Data File I/O pane displays several metrics for each database file:
- Database: The name of the database.
- File Type: Either Data (including tables and indexes) or Log (transaction log).
- Logical Name: The logical file name as defined in SQL Server.
- MB/sec Read: The rate of data being read from this file.
- MB/sec Written: The rate of data being written to this file.
- Response Time (ms): Average response time for I/O operations on this file.
These metrics refresh at the same interval as the Overview pane, giving you real-time visibility into disk activity.
3.4.2 Identifying I/O Bottlenecks
Watch for these patterns that indicate I/O performance issues:
- High Response Time: Response times consistently above 15-20ms suggest slow disk subsystems. Response times above 50ms indicate serious I/O bottlenecks.
- Unbalanced Load: If one data file shows significantly higher I/O rates than others in the same database, you may benefit from adding additional files to distribute the load.
- Excessive Tempdb Activity: High I/O rates on tempdb files often indicate queries creating large intermediate result sets or using inefficient execution plans.
3.4.3 Database File Analysis
Use the Data File I/O pane to understand how your databases use disk resources:
- Expand the Data File I/O pane.
- Sort by MB/sec Read or MB/sec Written to identify the most active files.
- Note any files with consistently high activity or long response times.
- Cross-reference this information with the Recent Expensive Queries pane to identify which queries are driving the I/O load.
3.5 Recent Expensive Queries Pane
The Recent Expensive Queries pane is often the most valuable pane for troubleshooting application performance issues. It shows queries that are consuming significant server resources, helping you identify optimization opportunities.

3.5.1 Understanding Query Metrics
Activity Monitor displays several metrics for each expensive query:
- Executions/min: How many times the query executed during the last minute.
- CPU (ms/sec): CPU time consumed by this query per second.
- Physical Reads/sec: Number of physical disk reads per second for this query.
- Logical Writes/sec: Number of logical writes (to buffer cache) per second.
- Logical Reads/sec: Number of logical reads (from buffer cache) per second.
- Average Duration (ms): Average execution time for this query.
- Plan Count: Number of execution plans in cache for this query.
These metrics help you understand not just which queries are expensive, but why they’re expensive and how often they run.
3.5.2 Sorting Options
You can sort the Recent Expensive Queries pane by different metrics to find different types of problems:
- Click any column header to sort by that metric.
- Common sorting strategies include:
- Sort by CPU: Find queries consuming the most processor time.
- Sort by Executions/min: Identify queries that run excessively often.
- Sort by Physical Reads: Find queries causing the most disk I/O.
- Sort by Average Duration: Locate long-running queries.
When troubleshooting a performance issue, try sorting by multiple columns to get different perspectives. A query with moderate CPU usage but extremely high executions per minute might be your real problem.
3.5.3 Viewing Query Text
To see the actual SQL statement behind an expensive query:
- Right-click on the query row in the Recent Expensive Queries pane.
- Select Edit Query Text.

- A new query window opens displaying the complete SQL statement.

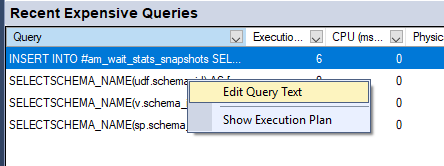
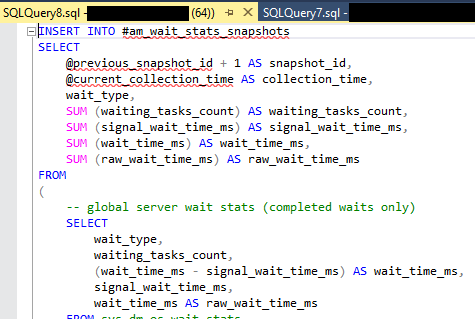
This allows you to examine the query logic and identify potential optimization opportunities. You can then copy the query text for testing modified versions.
3.5.4 Analyzing Execution Plans
Execution plans show you how SQL Server executes a query, revealing inefficiencies like missing indexes or inappropriate join types:
- Right-click on the query row in the Recent Expensive Queries pane.
- Select Show Execution Plan.

- SQL Server Management Studio displays a graphical representation of how the query executes.

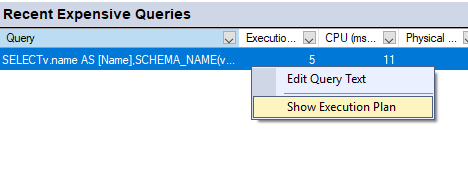
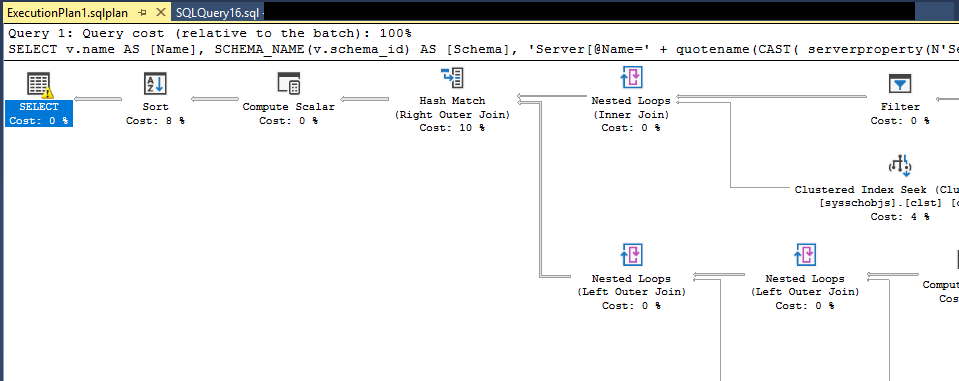
Look for operations that consume large percentages of the query cost, warnings about missing statistics or indexes, and unexpected table scan operations. These often indicate where optimization efforts should focus.
3.5.5 Identifying Problematic Queries
Watch for these patterns in the Recent Expensive Queries pane:
- Excessive Executions: A query executing thousands of times per minute might indicate an N+1 query problem where application code calls the database inside a loop.
- High Physical Reads: Queries with high physical read rates are hitting disk frequently, suggesting missing indexes or poorly written queries.
- High CPU with Low Duration: Many fast queries consuming lots of CPU in aggregate can impact server performance just as much as a few slow queries.
- Multiple Plan Counts: Queries with many execution plans may suffer from parameter sniffing issues or non-parameterized queries causing plan cache bloat.
4. Using Activity Monitor for Performance Troubleshooting
Activity Monitor truly shines when you use it systematically to diagnose and resolve performance problems. This section covers common troubleshooting scenarios and how to approach them.
4.1 Diagnosing Excessive Query Executions
One of the most common performance problems is queries executing far more frequently than necessary, often due to application design issues.
4.1.1 Identifying Repeated Queries
To spot queries that execute too often:
- Open Activity Monitor and expand the Recent Expensive Queries pane.
- Sort by Executions/min (executions per minute).
- Look for queries at the top with execution counts that seem unreasonably high.
- Right-click the suspect query and select Edit Query Text to examine the SQL statement.
For example, if you see a simple SELECT statement executing 37,000 times per minute, question whether the application really needs to call this query that frequently. Most queries executing more than a few thousand times per minute warrant investigation.
4.1.2 Root Cause Analysis
Excessive query executions typically stem from these issues:
- N+1 Query Problem: Application code retrieves a list of items, then executes a separate query for each item to fetch related data. This creates N additional queries where N is the number of items.
- Missing Caching: The application queries the database for data that rarely changes instead of caching it in application memory.
- Polling Loops: Code repeatedly queries the database checking for state changes rather than using change notifications or message queues.
- ORM Inefficiency: Entity Framework and similar tools sometimes generate inefficient query patterns when developers don’t understand how their code translates to SQL.
To determine the root cause, trace the query back to application code. Note the Application and Login columns in the Processes pane when the query executes. You can also right-click the process and select Trace Process in SQL Server Profiler to see the calling pattern.
4.1.3 Solutions and Best Practices
Once you’ve identified excessive query executions, consider these solutions:
- Batch Processing: Modify application code to retrieve multiple items in a single query using joins or IN clauses rather than executing separate queries in a loop.
- Result Caching: Cache frequently accessed, infrequently changing data in application memory with appropriate expiration times.
- Eager Loading: Configure ORMs to use eager loading strategies that fetch related data in fewer, more efficient queries.
- Query Parameterization: Ensure queries use parameters rather than concatenating values, which improves plan cache reuse and reduces compilation overhead.
4.2 Investigating Blocking Issues
Blocking occurs when one session holds locks that prevent other sessions from proceeding. This manifests as slow application response times and frustrated users.
4.2.1 Identifying Blocking Chains
To detect and analyze blocking:
- Open Activity Monitor and expand the Processes pane.
- Look for sessions with values in the Blocked By column—these are waiting for locks held by other sessions.
- Find sessions with ‘1’ in the Head Blocker column—these are the root cause of blocking chains.
- Note the Session ID of the head blocker.
- Right-click the head blocker session and select Details to see what command it’s executing.
Understanding the blocking chain is crucial. The head blocker is the session you need to investigate, not the blocked sessions downstream.
4.2.2 Understanding Lock Types
The Wait Type column in the Processes pane indicates what type of lock blocked sessions are waiting for:
- LCK_M_X: Exclusive lock wait, typically caused by UPDATE, DELETE, or INSERT operations.
- LCK_M_S: Shared lock wait, usually SELECT statements waiting for exclusive locks to release.
- LCK_M_U: Update lock wait, an intermediate lock type used during updates.
- LCK_M_IX: Intent exclusive lock wait, indicating page or row-level lock contention.
The Wait Resource column shows which database object is being locked, helping you understand which table or index is involved in the contention.
4.2.3 Resolving Blocking Issues
Once you’ve identified the blocking session and what it’s doing, you have several options:
- Wait for Completion: If the head blocker is running a legitimate query that will complete soon, it may be best to let it finish naturally.
- Kill the Session: If the head blocker is stuck or running a query that should be canceled:
- Right-click the session in the Processes pane.
- Select Kill Process.
- Confirm the action in the dialog box.
- Optimize Queries: If blocking recurs with the same queries, optimize them to reduce their lock duration.
- Adjust Isolation Levels: Consider using READ COMMITTED SNAPSHOT ISOLATION to reduce blocking in read-heavy workloads.
- Index Tuning: Add indexes to speed up queries, reducing how long they hold locks.
4.3 Analyzing High CPU Usage
When the Overview pane shows processor time consistently at or near 100%, you need to identify which queries are responsible and determine if they can be optimized.
4.3.1 Identifying CPU-Intensive Queries
To find queries consuming excessive CPU:
- Open the Recent Expensive Queries pane.
- Sort by CPU (ms/sec) to show queries using the most CPU time.
- Examine the top queries in the list.
- Right-click on high CPU queries and select Edit Query Text to view the SQL statement.
- Select Show Execution Plan to understand how the query executes.
Pay attention not just to individual query CPU usage but also to the Executions/min column. A query using moderate CPU per execution but running thousands of times per minute can be your biggest CPU consumer.
4.3.2 Query Optimization Techniques
Common approaches to reduce CPU consumption include:
- Add Missing Indexes: Index seeks use far less CPU than table scans. Look for missing index recommendations in execution plans.
- Rewrite Inefficient Queries: Replace cursors with set-based operations, eliminate unnecessary functions in WHERE clauses, and remove redundant joins.
- Update Statistics: Outdated statistics cause SQL Server to choose inefficient execution plans. Run UPDATE STATISTICS on affected tables.
- Reduce Data Volume: Add WHERE clauses to filter data earlier, use TOP or OFFSET/FETCH for pagination, and avoid SELECT *.
- Fix Parameter Sniffing: Use OPTION (RECOMPILE), query hints, or plan guides when parameter sniffing causes problems.
4.4 Investigating Memory Issues
Memory pressure can cause queries to spill to disk, degrading performance significantly. Activity Monitor helps you identify memory-intensive operations.
4.4.1 Understanding Memory Metrics
The Memory Use column in the Processes pane shows memory allocated to each session in kilobytes. High memory usage by a single session often indicates:
- Large sort or hash operations that couldn’t fit in the initially granted memory
- Queries retrieving enormous result sets
- Excessive parallelism creating many copies of execution plan operators
- Memory leaks in CLR stored procedures or functions
The Resource Waits pane may show Memory waits when queries cannot obtain sufficient memory grants and must wait for memory to become available.
4.4.2 Identifying Memory-Intensive Queries
To find queries causing memory pressure:
- In the Processes pane, sort by Memory Use to see sessions consuming the most memory.
- Right-click sessions with high memory usage and select Details to view their queries.
- In the Recent Expensive Queries pane, look for queries with high Logical Reads or Logical Writes, as these often correlate with memory usage.
- Examine execution plans for Sort and Hash Match operators, which use memory grants.
Queries showing “Memory Grant” warnings in execution plans or spill warnings indicate memory pressure issues.
4.5 Detecting Application Performance Problems
When users report slow application response times, Activity Monitor helps you determine whether the database is the bottleneck.
4.5.1 Correlating Activity Monitor with Application Issues
To investigate application slowness:
- Note the exact time users report problems and the applications affected.
- Open Activity Monitor and check the Overview pane for resource spikes at that time.
- In the Processes pane, filter by Application to show only connections from the affected application.
- Look for high Wait Time values, which indicate database delays.
- Check the Recent Expensive Queries pane for queries from that application consuming significant resources.
If the database shows no unusual activity while users experience slowness, the problem likely lies in application code, network latency, or client-side performance.
4.5.2 Identifying Inefficient Application Patterns
Activity Monitor reveals several anti-patterns in application design:
- Chatty Applications: Many small queries instead of fewer, more efficient queries. Identified by high connection counts and numerous simple queries in Recent Expensive Queries.
- N+1 Queries: One query followed by N additional queries for related data. Shows as a simple query with extremely high executions per minute.
- Large Result Sets: Applications retrieving far more data than needed. Look for high Logical Reads combined with simple SELECT * queries.
- Missing Timeouts: Applications that don’t set command timeouts may leave connections open indefinitely, visible as long-running sessions in the Processes pane.
5. Alternative Methods: Getting Activity Monitor Data via T-SQL
While Activity Monitor provides a convenient graphical interface, sometimes you need to retrieve equivalent information programmatically or create custom monitoring solutions.
5.1 Using Dynamic Management Views (DMVs)
SQL Server exposes activity information through dynamic management views, which Activity Monitor queries behind the scenes.
5.1.1 Key DMVs for Activity Monitoring
The most important DMVs for replicating Activity Monitor functionality include:
- sys.dm_exec_requests: Shows currently executing requests with CPU, I/O, and wait information.
- sys.dm_exec_sessions: Contains session-level information like login name, host name, and program name.
- sys.dm_os_wait_stats: Provides cumulative wait statistics for the entire instance.
- sys.dm_exec_query_stats: Contains aggregate performance statistics for cached queries.
- sys.dm_io_virtual_file_stats: Returns I/O statistics for data and log files.
- sys.dm_exec_sql_text: Retrieves the SQL text for a given sql_handle or plan_handle.
- sys.dm_exec_query_plan: Returns the execution plan for a cached query.
5.1.2 Sample Queries for Process Information
To replicate the Processes pane functionality, you can query:
SELECT
    s.session_id AS [Session ID],
    CASE WHEN s.is_user_process = 1 THEN 'Yes' ELSE 'No' END AS [User Process],
    s.login_name AS [Login],
    ISNULL(CAST(r.blocking_session_id AS VARCHAR), '') AS [Blocked By],
    CASE
        WHEN r2.session_id IS NOT NULL
        AND (r.blocking_session_id = 0 OR r.session_id IS NULL)
        THEN '1'
        ELSE ''
    END AS [Head Blocker],
    ISNULL(DB_NAME(r.database_id), '') AS [Database],
    ISNULL(t.task_state, '') AS [Task State],
    ISNULL(r.command, '') AS [Command],
    r.cpu_time AS [CPU Time],
    r.total_elapsed_time AS [Elapsed Time],
    r.wait_time AS [Wait Time],
    r.wait_type AS [Wait Type],
    s.memory_usage * 8 AS [Memory Use (KB)],
    s.host_name AS [Host Name],
    s.program_name AS [Application]
FROM sys.dm_exec_sessions s
LEFT JOIN sys.dm_exec_requests r ON s.session_id = r.session_id
LEFT JOIN sys.dm_exec_requests r2 ON r.session_id = r2.blocking_session_id
LEFT JOIN sys.dm_os_tasks t ON r.session_id = t.session_id
WHERE s.session_id != @@SPID
ORDER BY s.session_id;
5.1.3 Sample Queries for Wait Statistics
To see wait statistics similar to the Resource Waits pane:
SELECT TOP 10
    wait_type AS [Wait Type],
    wait_time_ms / 1000.0 AS [Wait Time (sec)],
    waiting_tasks_count AS [Waiting Tasks],
    wait_time_ms / NULLIF(waiting_tasks_count, 0) AS [Avg Wait Time (ms)]
FROM sys.dm_os_wait_stats
WHERE wait_type NOT LIKE '%SLEEP%'
    AND wait_type NOT LIKE '%IDLE%'
    AND wait_type NOT LIKE '%QUEUE%'
ORDER BY wait_time_ms DESC;
5.2 Using sp_WhoIsActive
sp_WhoIsActive is a powerful community-created stored procedure that provides more detailed information than Activity Monitor in a single result set.
5.2.1 Installing sp_WhoIsActive
To install sp_WhoIsActive:
- Download the latest version from
http://whoisactive.com. - The download is a SQL script containing the procedure definition.
- Open the script in SQL Server Management Studio.
- Connect to your SQL Server instance.
- Execute the script to create the procedure in the master database.
- Grant execute permissions to appropriate users.
Because sp_WhoIsActive is installed in master, it’s accessible from any database context.
5.2.2 Basic Usage Examples
The simplest way to use sp_WhoIsActive is:
EXEC sp_WhoIsActive;
This returns a result set showing all active sessions with their queries, wait types, blocking information, and resource usage.
For a 10-second sample showing activity over that period:
EXEC sp_WhoIsActive @delta_interval = 10;
This calculates deltas for metrics like CPU and reads, showing what happened during those 10 seconds.
5.2.3 Advanced Parameters
sp_WhoIsActive supports numerous parameters for customization:
- @filter: Filter results to specific sessions, databases, or logins.
- @filter_type: Specify what the filter applies to (session, database, login, etc.).
- @get_plans: Include execution plans in the results (set to 1).
- @get_locks: Show detailed lock information (set to 1).
- @get_transaction_info: Display transaction details (set to 1).
- @sort_order: Order results by different metrics (CPU, reads, duration, etc.).
- @destination_table: Insert results into a table for historical tracking.
Example showing plans sorted by CPU:
EXEC sp_WhoIsActive
    @get_plans = 1,
    @sort_order = '[CPU] DESC';
5.3 Using System Stored Procedures
SQL Server includes traditional stored procedures for monitoring activity, though they provide less information than DMVs or Activity Monitor.
5.3.1 sp_who and sp_who2
The sp_who procedure shows basic session information:
EXEC sp_who;
The sp_who2 procedure provides slightly more detail:
EXEC sp_who2;
Both procedures show session IDs, login names, CPU time, and blocking information. However, they lack the rich detail available through DMVs or Activity Monitor. They’re most useful for quick checks when you need minimal information quickly.
5.3.2 Other Useful System Procedures
Additional system procedures for monitoring include:
- sp_lock: Shows lock information (deprecated; use sys.dm_tran_locks instead).
- sp_monitor: Displays statistics about SQL Server activity.
- sp_help: Shows object definitions and metadata.
- DBCC SQLPERF: Displays transaction log space usage and wait statistics.
5.4 Creating Custom Monitoring Scripts
For environments requiring specific monitoring beyond what Activity Monitor provides, you can build custom solutions using DMVs.
5.4.1 Complete Activity Monitor Equivalent Script
Here’s a comprehensive script that replicates most Activity Monitor functionality:
-- Processes Information
SELECT
    s.session_id AS [Session ID],
    CONVERT(CHAR(1), s.is_user_process) AS [User Process],
    s.login_name AS [Login],
    ISNULL(CONVERT(VARCHAR, w.blocking_session_id), '') AS [Blocked By],
    CASE
        WHEN r2.session_id IS NOT NULL
        AND (r.blocking_session_id = 0 OR r.session_id IS NULL)
        THEN '1'
        ELSE ''
    END AS [Head Blocker],
    ISNULL(DB_NAME(r.database_id), N'') AS [Database],
    ISNULL(t.task_state, N'') AS [Task State],
    ISNULL(r.command, N'') AS [Command],
    SUBSTRING(st.text, (r.statement_start_offset/2) + 1,
        ((CASE r.statement_end_offset
            WHEN -1 THEN DATALENGTH(st.text)
            ELSE r.statement_end_offset
        END - r.statement_start_offset) / 2) + 1) AS [Statement],
    st.text AS [Command Text],
    r.cpu_time AS [CPU Time (ms)],
    r.total_elapsed_time / 1000 AS [Elapsed Time (sec)],
    r.wait_time AS [Wait Time (ms)],
    r.wait_type AS [Wait Type],
    r.wait_resource AS [Wait Resource],
    s.memory_usage * 8 AS [Memory Use (KB)],
    s.host_name AS [Host Name],
    c.client_net_address AS [Net Address],
    s.program_name AS [Application]
FROM sys.dm_exec_sessions s
LEFT JOIN sys.dm_exec_requests r ON s.session_id = r.session_id
LEFT JOIN sys.dm_exec_requests w ON r.session_id = w.blocking_session_id
LEFT JOIN sys.dm_exec_requests r2 ON r.session_id = r2.blocking_session_id
LEFT JOIN sys.dm_os_tasks t ON r.session_id = t.session_id
    AND r.request_id = t.request_id
LEFT JOIN sys.dm_exec_connections c ON s.session_id = c.session_id
OUTER APPLY sys.dm_exec_sql_text(r.sql_handle) st
WHERE s.session_id != @@SPID
ORDER BY s.session_id;

-- Recent Expensive Queries
SELECT TOP 20
    qs.execution_count /
        DATEDIFF(MINUTE, qs.creation_time, GETDATE()) AS [Executions/min],
    qs.total_worker_time / 1000 AS [CPU Time (ms)],
    qs.total_physical_reads AS [Physical Reads],
    qs.total_logical_writes AS [Logical Writes],
    qs.total_logical_reads AS [Logical Reads],
    qs.total_elapsed_time / qs.execution_count / 1000 AS [Avg Duration (ms)],
    SUBSTRING(st.text, (qs.statement_start_offset/2) + 1,
        ((CASE qs.statement_end_offset
            WHEN -1 THEN DATALENGTH(st.text)
            ELSE qs.statement_end_offset
        END - qs.statement_start_offset) / 2) + 1) AS [Query Text]
FROM sys.dm_exec_query_stats qs
CROSS APPLY sys.dm_exec_sql_text(qs.sql_handle) st
WHERE qs.execution_count > 0
ORDER BY qs.total_worker_time DESC;
5.4.2 Automating Monitoring with SQL Agent Jobs
You can schedule custom monitoring scripts using SQL Server Agent:
- Create a table to store monitoring results.
- Modify your monitoring script to insert results into this table.
- In SQL Server Management Studio, expand SQL Server Agent in Object Explorer.
- Right-click Jobs and select New Job.
- Configure the job to run your monitoring script at regular intervals.
- Set up alerts or reports based on the collected data.
This approach enables historical tracking and trend analysis that Activity Monitor doesn’t provide.
6. Activity Monitor Limitations and Considerations
While Activity Monitor is valuable, understanding its limitations helps you use it appropriately and supplement it with other tools when necessary.
6.1 Understanding Activity Monitor’s Overhead
Activity Monitor isn’t free—it consumes server resources to collect and display information. Understanding this overhead helps you use it responsibly.
6.1.1 Impact on Server Resources
Activity Monitor runs queries against system DMVs every time it refreshes. These queries consume CPU, generate logical reads, and can briefly hold locks on system tables. On busy servers, this overhead can impact performance.
The Processes and Recent Expensive Queries panes are particularly expensive, as they must scan potentially large DMVs and cache tables. On servers with thousands of cached query plans, refreshing Recent Expensive Queries can take several seconds.
Microsoft’s documentation warns that refresh intervals below 10 seconds can noticeably affect server performance, especially on already-loaded systems.
6.1.2 Refresh Interval Best Practices
Choose refresh intervals appropriate for your situation:
- 1-5 seconds: Only for immediate troubleshooting of critical issues on lightly loaded servers. Don’t leave Activity Monitor running at these intervals.
- 10 seconds (default): Reasonable for most troubleshooting scenarios and general monitoring.
- 30-60 seconds: Better choice for production servers under heavy load or when monitoring for extended periods.
- Manual refresh only: For situations where you want to check current state occasionally without continuous polling.
Always close Activity Monitor when you’re done investigating. Don’t leave it running continuously, especially multiple instances from different users.
6.2 Wait Type Grouping Issues
Activity Monitor’s approach to categorizing waits, while simplifying the view, can obscure important diagnostic information.
6.2.1 How Activity Monitor Groups Waits
SQL Server tracks hundreds of distinct wait types, each indicating a specific resource or condition. Activity Monitor groups these into broad categories like “Buffer Latch,” “Lock,” and “Memory.”
For example, the “Buffer Latch” category includes PAGELATCH_SH, PAGELATCH_UP, PAGELATCH_EX, and several other specific wait types. While they’re all related to page access, they have different causes and solutions.
Microsoft doesn’t document exactly which wait types map to which categories, making it difficult to understand what you’re really seeing.
6.2.2 Missing Wait Types
Activity Monitor doesn’t show all wait types. Most notably, it often omits CXPACKET waits, which indicate parallel query execution. CXPACKET waits are common and usually not problematic, but knowing they’re present helps you understand workload characteristics.
When Activity Monitor shows “Buffer Latch” as your top wait but other tools show CXPACKET dominating, the discrepancy comes from Activity Monitor’s filtering and grouping logic.
6.2.3 Why Specific Wait Types Matter
Knowing the specific wait type matters for troubleshooting:
- PAGELATCH_EX: Often indicates tempdb contention on allocation pages. Solution involves adding more tempdb data files.
- PAGELATCH_SH: Might indicate hot pages in user tables. Solution involves partitioning or index reorganization.
- PAGELATCH_UP: Common during updates. May indicate normal operation rather than a problem.
Activity Monitor groups all of these under “Buffer Latch,” making diagnosis harder. Tools like sp_WhoIsActive and DMV queries show specific wait types.
6.3 Data Accuracy and Timeliness
Activity Monitor provides a near-real-time view, but “near” is the operative word. Understanding its data collection method helps you interpret results correctly.
6.3.1 Snapshot vs Continuous Monitoring
Activity Monitor shows point-in-time snapshots taken at each refresh interval. Events occurring between snapshots aren’t captured. If a query runs for 2 seconds and you’re refreshing every 10 seconds, you might see it once or not at all, depending on timing.
This means Activity Monitor excels at finding persistent problems (blocking lasting minutes, consistently high CPU) but may miss transient issues (brief deadlocks, occasional query spikes).
6.3.2 Aggregation and Sampling
The Recent Expensive Queries pane shows data aggregated since query plans entered cache. Two identical queries with different parameter values appear as one row if they share a plan. This aggregation can mask problems with specific parameter combinations (parameter sniffing issues).
The Resource Waits pane calculates rates by comparing snapshots. If wait statistics reset between snapshots (rare but possible), the calculated rates may be incorrect.
6.4 When NOT to Use Activity Monitor
Activity Monitor isn’t appropriate for every monitoring scenario. Recognize when alternative tools are better choices.
6.4.1 Historical Analysis Requirements
Activity Monitor shows only current or recent activity. It doesn’t store historical data. If you need to analyze trends over days or weeks, compare current performance to baselines, or generate reports on performance patterns, Activity Monitor isn’t sufficient.
For historical analysis, use SQL Server’s built-in Performance Dashboard, Extended Events with file targets, or third-party monitoring solutions.
6.4.2 Detailed Wait Statistics Needs
When you need precise wait type information for advanced tuning, Activity Monitor’s grouping and filtering make it inadequate. Use DMV queries directly or sp_WhoIsActive instead.
For comprehensive wait statistics analysis, query sys.dm_os_wait_stats directly and filter out benign waits manually.
6.4.3 Production Server Considerations
On production servers under heavy load, Activity Monitor’s overhead can be problematic. Multiple database administrators shouldn’t all run Activity Monitor simultaneously on the same server.
For production monitoring, consider lightweight alternatives like scheduled DMV snapshots stored in a monitoring database, or use Read-Only routing to monitor secondary replicas in Always On configurations.
7. Best Practices for Using Activity Monitor
Following best practices ensures you get maximum value from Activity Monitor while minimizing negative impacts on your servers.
7.1 When to Use Activity Monitor
Activity Monitor shines in specific scenarios. Use it when its strengths align with your needs.
7.1.1 Real-Time Performance Issues
Activity Monitor is ideal when users are currently experiencing problems and you need to diagnose the issue immediately. The real-time view helps you see what’s happening right now.
When you get a call that “the application is slow,” opening Activity Monitor should be one of your first steps. You can quickly determine if the database is busy, blocked, or idle.
7.1.2 Application Slowdown Investigation
When a specific application becomes unresponsive, Activity Monitor helps you determine whether database issues are the cause. Filter the Processes pane by application name to see only that application’s database activity.
If the application shows no database activity while users report problems, the issue lies elsewhere in the stack. If you see extensive blocking or expensive queries, you’ve found your culprit.
7.1.3 Quick Health Checks
Activity Monitor provides an excellent dashboard for quick health checks during routine administration. Open it, glance at the Overview graphs, and verify nothing looks abnormal.
This cursory check takes seconds and can reveal problems before they become critical. Make it part of your daily routine.
7.2 Optimal Configuration Settings
Configuring Activity Monitor appropriately improves both its usefulness and its resource footprint.
7.2.1 Recommended Refresh Intervals
Match your refresh interval to your purpose:
- Active troubleshooting: 10 seconds provides good responsiveness with reasonable overhead.
- Extended monitoring: 30-60 seconds reduces server impact during longer observation periods.
- Critical issue diagnosis: 5 seconds gives high granularity when every second counts, but use briefly.
- Regular health checks: Manual refresh (1 hour interval) when you’re not actively watching.
Remember to close Activity Monitor when finished. Setting it to a long interval and forgetting about it wastes server resources.
7.2.2 Filtering Strategies
Use filters to focus on relevant information and reduce cognitive load:
- Filter Processes by Database to see only activity against specific databases.
- Filter by Login to track a specific user’s activity.
- Filter by Task State = RUNNING to hide idle sessions.
- Filter by Application to isolate traffic from specific programs.
- Show only NonBlanks in Blocked By to see only blocking situations.
7.2.3 Column Selection and Sorting
Develop a systematic approach to reviewing Activity Monitor data:
- Start with Overview: Check graphs for obvious spikes or anomalies.
- Check Processes for blocking: Sort by Session ID, then look for Blocked By values.
- Review Resource Waits: Sort by Cumulative Wait Time to identify resource bottlenecks.
- Analyze Expensive Queries: Sort by different metrics (CPU, executions, reads) to find different problem types.
- Verify with I/O Pane: Confirm whether I/O-intensive queries correlate with high disk activity.
7.3 Integration with Other Tools
Activity Monitor works best as part of a broader toolkit rather than as a standalone solution.
7.3.1 Using with SQL Server Profiler
Activity Monitor and SQL Server Profiler complement each other well. When you identify a problematic session in Activity Monitor, right-click it and select Trace Process in SQL Server Profiler.
This launches Profiler with filters already configured to capture only that session’s activity. You see the complete sequence of statements executed, timing information, and error messages—detail that Activity Monitor doesn’t provide.
To learn more about SQL Server Profiler capabilities and advanced tracing techniques, see our comprehensive SQL Server Profiler guide.
7.3.2 Complementing with Extended Events
Extended Events offers low-overhead, detailed monitoring that captures information Activity Monitor misses. Create Extended Event sessions to track specific events like deadlocks, long-running queries, or excessive recompilations.
Use Activity Monitor for immediate investigation and Extended Events for ongoing monitoring and historical analysis. The two tools address different needs.
To learn more about SQL Server Extended Events capabilities and advanced monitoring techniques, see our comprehensive SQL Server Extended Events guide.
7.3.3 Third-Party Monitoring Solutions
Commercial tools like SolarWinds Database Performance Analyzer, Redgate SQL Monitor, and Quest Spotlight provide features Activity Monitor lacks: alerting, historical trending, capacity planning, and automated diagnostics.
These tools are valuable additions to Activity Monitor, not replacements. Activity Monitor remains useful for quick checks and investigation even when sophisticated monitoring tools are available.
7.4 Common Mistakes to Avoid
Understanding common Activity Monitor mistakes helps you use it more effectively.
7.4.1 Leaving Activity Monitor Running Continuously
The most common mistake is opening Activity Monitor and leaving it running indefinitely. This wastes server resources and provides little value since you’re not actively watching.
Close Activity Monitor when you’re not actively using it. If you need continuous monitoring, implement a proper monitoring solution with scheduled data collection instead.
7.4.2 Over-Relying on Activity Monitor Alone
Activity Monitor provides one perspective on server health. Don’t rely on it exclusively. Supplement with Windows Performance Monitor for OS-level metrics, Extended Events for detailed tracking, and execution plan analysis for query tuning.
Activity Monitor helps you identify problems, but solving them often requires additional tools and deeper analysis.
Learn more about SQL Server performance monitor in our complete guide.
7.4.3 Ignoring Historical Trends
Activity Monitor shows current state, but performance problems often have patterns visible only over time. Implement historical data collection so you can compare current metrics to baselines and identify trends.
Without historical context, you might not recognize that today’s “normal” CPU usage is 30% higher than last month’s baseline, indicating a gradual degradation.
8. Troubleshooting Activity Monitor Issues
Activity Monitor itself sometimes experiences problems. Knowing how to troubleshoot these issues prevents frustration.
8.1 Activity Monitor Won’t Open or Displays No Data
When Activity Monitor opens but shows blank panes or won’t open at all, several factors might be responsible.
8.1.1 Permission Issues
The most common cause of Activity Monitor problems is insufficient permissions. To verify and resolve:
- Check your server-level permissions:
SELECT * FROM fn_my_permissions(NULL, 'SERVER') WHERE permission_name = 'VIEW SERVER STATE'; - If no rows return, you lack VIEW SERVER STATE permission.
- Ask a server administrator to grant it:
USE master; GRANT VIEW SERVER STATE TO [YourLogin]; - Close and reopen Activity Monitor after permissions are granted.
8.1.2 Version Compatibility Issues
Using an old version of SQL Server Management Studio to connect to a newer SQL Server version can cause Activity Monitor failures. The tool may not understand new wait types or system view columns.
Always use SSMS version that matches or is newer than your SQL Server version. Microsoft provides the latest SSMS as a free download separate from SQL Server itself.
8.1.3 Firewall and Network Issues
Activity Monitor requires connectivity to the SQL Server instance on standard ports (1433 by default). If you can connect via Object Explorer but Activity Monitor fails, firewall rules might be blocking specific connections.
Verify that your client can reach the SQL Server machine on all necessary ports. Check both Windows Firewall and any network firewalls between your client and the server.
8.2 Activity Monitor Permanently Paused
A common issue, particularly in SQL Server 2019, is Activity Monitor opening in a paused state and refusing to resume.
8.2.1 Understanding the Paused State
When Activity Monitor pauses, all panes show “Paused” status with a resume button that may not function. This prevents you from seeing any server activity.
The paused state usually occurs due to permission issues, remote connection restrictions, or SSMS version bugs rather than an intentional pause action.
8.2.2 Common Causes
Activity Monitor may enter permanent paused state due to:
- Missing VIEW SERVER STATE permission on newer panes added in recent SQL Server versions
- Remote connections disabled on the SQL Server instance
- Authentication failures for specific system queries
- Bugs in specific SSMS builds, particularly 18.0 through 18.3
- Connectivity issues between client and server
8.2.3 Resolution Steps
To resolve Activity Monitor paused state issues:
- Update SSMS: Download and install the latest SQL Server Management Studio version from Microsoft’s website. Many paused state bugs were fixed in later releases.
- Verify permissions: Ensure you have VIEW SERVER STATE and VIEW ANY DEFINITION permissions.
- Check remote connections: Verify that the SQL Server instance allows remote connections:
EXEC sp_configure 'remote access';If the value is 0, ask an administrator to enable it.
- Restart SSMS: Sometimes simply closing all windows and restarting SQL Server Management Studio resolves the issue.
- Connect with Windows Authentication: If using SQL authentication, try Windows authentication instead, as it sometimes bypasses authentication-related pausing issues.
8.3 Performance Issues When Using Activity Monitor
If Activity Monitor itself becomes slow or causes server performance degradation, adjustment is needed.
8.3.1 Reducing Monitoring Overhead
To minimize Activity Monitor’s impact:
- Increase the refresh interval to 30 seconds or 1 minute.
- Close panes you’re not actively using by clicking the collapse button.
- When panes are collapsed, Activity Monitor doesn’t query data for them.
- Avoid running multiple Activity Monitor instances simultaneously.
- Close Activity Monitor entirely when not actively investigating issues.
8.3.2 Alternative Lightweight Monitoring Methods
If Activity Monitor is too resource-intensive for your environment, consider alternatives:
- Query DMVs directly: Write specific T-SQL queries that retrieve only the information you need.
- Use sp_WhoIsActive: This stored procedure is highly optimized and typically has lower overhead than Activity Monitor.
- Implement sampling: Schedule SQL Agent jobs that capture snapshots of DMV data at regular intervals, storing results in tables for later analysis.
- Monitor secondary replicas: In Always On availability groups, run Activity Monitor against a readable secondary rather than the primary.
8.4 Inaccurate or Missing Information
Sometimes Activity Monitor displays information that seems incorrect or incomplete.
8.4.1 Verifying Data with DMVs
When Activity Monitor results seem suspicious, verify them by querying the underlying DMVs directly. For example, if the Processes pane shows no blocking but users report it, query:
SELECT
    blocking_session_id,
    session_id,
    wait_type,
    wait_time,
    wait_resource
FROM sys.dm_exec_requests
WHERE blocking_session_id != 0;
If this query shows blocking that Activity Monitor missed, you’ve confirmed a display issue.
8.4.2 Understanding Data Refresh Timing
Remember that Activity Monitor shows snapshots. A query that ran between refresh intervals won’t appear in Recent Expensive Queries unless its execution plan remains in cache.
Similarly, wait statistics in the Resource Waits pane reflect accumulation since the last snapshot. Rapidly changing workloads may show different patterns each refresh.
9. Advanced Activity Monitor Techniques
Experienced database administrators use Activity Monitor in sophisticated ways to extract maximum diagnostic value.
9.1 Combining Multiple Panes for Root Cause Analysis
The real power of Activity Monitor emerges when you correlate information across multiple panes to understand complex performance issues.
9.1.1 Correlating Waits with Processes
When the Resource Waits pane shows high wait times in a category, use the Processes pane to identify which sessions are experiencing those waits:
- Note the wait category with high cumulative wait time (e.g., “Lock”).
- Switch to the Processes pane.
- Sort by Wait Type to group sessions by their current wait.
- Look for sessions showing wait types in the problematic category.
- For those sessions, examine the Wait Resource column to see which database objects are involved.
- Right-click and select Details to see the query text.
This correlation helps you move from “we have lock waits” to “this specific query is waiting for locks on this table.”
9.1.2 Linking Expensive Queries to I/O Issues
When the Data File I/O pane shows high disk activity on a specific database:
- Note which database files have high MB/sec read or write rates.
- Switch to Recent Expensive Queries.
- Sort by Physical Reads/sec to identify queries reading heavily from disk.
- Filter or visually identify queries running against the database with high I/O.
- Examine those queries’ execution plans for table scans or missing indexes causing excessive I/O.
This multi-pane analysis connects symptoms (high disk I/O) with causes (specific inefficient queries).
9.2 Using Activity Monitor for Capacity Planning
While Activity Monitor doesn’t store historical data, you can use it strategically for capacity planning observations.
9.2.1 Identifying Peak Usage Patterns
Monitor server activity at different times of day to identify usage patterns:
- Open Activity Monitor during known peak business hours.
- Note the % Processor Time graph’s peak values.
- Record the maximum Waiting Tasks count.
- Observe Batch Requests/sec at peak times.
- Document the busiest databases in the Processes pane.
- Repeat during off-peak hours for comparison.
If peak-hour processor time consistently exceeds 80%, you’re approaching CPU capacity limits. Similarly, increasing wait counts indicate growing resource contention.
9.2.2 Resource Trend Analysis
While Activity Monitor shows current state, you can use it for spot-check trending by recording key metrics over time:
- Take screenshots of the Overview pane at the same time each day
- Record peak values from each graph
- Compare week-over-week to identify growth trends
- Watch for gradual increases in average processor time or I/O rates
This manual trending supplements more sophisticated monitoring solutions and helps justify capacity expansion.
9.3 Documenting Performance Baselines
Establishing baseline performance metrics helps you recognize when performance degrades.
9.3.1 Capturing Baseline Metrics
During periods of known good performance, document Activity Monitor metrics:
- Open Activity Monitor during normal business operations (not peak or off-peak).
- Record Overview pane values:
- Typical % Processor Time range
- Average Waiting Tasks count
- Normal Database I/O rate
- Typical Batch Requests/sec
- Note Resource Waits pane categories that show the most wait time.
- Document the number of active processes typically in the Processes pane.
- Record representative query execution metrics from Recent Expensive Queries.
Store this baseline documentation for future reference when investigating performance problems.
9.3.2 Comparing Current vs Baseline Performance
When performance issues arise, compare current Activity Monitor readings to your documented baseline:
- Is processor time significantly higher than baseline? Focus on CPU-intensive queries.
- Are waiting tasks 2-3x baseline levels? Investigate resource waits.
- Is I/O substantially higher? Check Data File I/O pane and expensive queries.
- Are batch requests lower than baseline during peak hours? Look for blocking or connectivity issues.
This comparison helps you identify what’s changed and focus troubleshooting efforts appropriately.
9.4 Creating Custom Monitoring Workflows
Develop systematic workflows for common investigation scenarios to ensure thorough, repeatable analysis.
9.4.1 Step-by-Step Investigation Process
When users report performance issues, follow a consistent workflow:
- Quick health check: Open Activity Monitor and scan Overview pane graphs for obvious anomalies.
- Check for blocking: Expand Processes pane, filter for NonBlanks in Blocked By column.
- Identify resource contention: Review Resource Waits pane sorted by wait time.
- Find expensive queries: Examine Recent Expensive Queries sorted by CPU, then executions, then reads.
- Correlate I/O patterns: Cross-reference expensive queries with Data File I/O pane activity.
- Document findings: Take screenshots and record relevant session IDs, wait types, and query details.
- Deep dive: Use Profiler traces, execution plan analysis, and DMV queries for detailed investigation of identified issues.
9.4.2 Escalation Criteria
Establish criteria for when to escalate issues versus continuing investigation:
- Escalate immediately: Blocking chains lasting >5 minutes, processor time at 100% for >2 minutes, critical system processes showing SUSPENDED state.
- Escalate with analysis: Recurring expensive queries consuming >50% CPU, consistent high I/O response times >50ms, memory grants failing repeatedly.
- Investigate further: Temporary waits resolving within minutes, queries with suboptimal plans but acceptable performance, minor blocking <30 seconds duration.
10. Activity Monitor in Different SQL Server Versions
Activity Monitor has evolved across SQL Server versions, with each release bringing enhancements and occasionally new issues.
10.1 Activity Monitor in SQL Server 2008 and Later
SQL Server 2008 introduced the modern Activity Monitor design that remains largely unchanged today.
10.1.1 New Features Introduced in SQL Server 2008
The SQL Server 2008 Activity Monitor redesign brought significant improvements:
- Graphical dashboard with real-time charts in the Overview pane
- Expandable/collapsible pane interface replacing the old grid-only view
- Recent Expensive Queries pane showing aggregate query performance data
- Data File I/O pane for per-file disk activity monitoring
- Enhanced Resource Waits pane with wait categorization
- Right-click context menus for process actions like killing sessions and launching Profiler
- Configurable refresh intervals from 1 second to 1 hour
These changes transformed Activity Monitor from a simple process list to a comprehensive monitoring dashboard.
10.1.2 Changes from SQL Server 2005
SQL Server 2005’s Activity Monitor was far more limited:
- Accessed through Management folder in Object Explorer rather than toolbar
- Single grid showing process list with basic information
- No graphical charts or multiple panes
- No expensive queries or I/O monitoring
- Limited wait statistics information
The 2008 redesign represented a complete reimagining rather than an incremental improvement.
10.2 Activity Monitor in SQL Server 2014/2016
SQL Server 2014 and 2016 made incremental improvements to Activity Monitor’s underlying data collection but few visual changes.
10.2.1 Improvements and Enhancements
Key improvements in these versions included:
- Better performance when monitoring servers with thousands of cached plans
- Enhanced filtering capabilities in the Processes pane
- Improved accuracy of wait statistics aggregation
- Better handling of column sorting and filtering with large result sets
- More efficient DMV queries reducing monitoring overhead
The core interface remained consistent with SQL Server 2008, maintaining familiarity for administrators.
10.3 Activity Monitor in SQL Server 2019/2022
Recent SQL Server versions continue Activity Monitor’s evolution with focus on performance and stability.
10.3.1 Latest Features and Capabilities
SQL Server 2019 and 2022 Activity Monitor includes:
- Support for new wait types introduced in these versions
- Improved rendering performance in SSMS using WPF technology
- Better handling of large numbers of active sessions
- Enhanced compatibility with cloud SQL platforms
- More accurate CPU and I/O metrics
10.3.2 Known Issues in Recent Versions
SQL Server 2019 introduced several Activity Monitor bugs:
- Permanent Paused State: Activity Monitor frequently enters paused state and won’t resume, particularly in SSMS 18.0-18.3. Fixed in later SSMS versions.
- Remote Connection Failures: Some configurations prevent Activity Monitor from opening on remote instances. Workarounds include enabling specific trace flags or using newer SSMS builds.
- Permission Issues: New system views require additional permissions not documented clearly, causing blank displays even with VIEW SERVER STATE.
Always use the latest SSMS version when working with SQL Server 2019 and 2022 to avoid these issues.
11. Practical Use Cases and Examples
Real-world examples demonstrate how to apply Activity Monitor effectively in common troubleshooting scenarios.
11.1 Case Study: Diagnosing a Slow Web Application
A development team reports that their web application has become unacceptably slow, with page loads taking 20-30 seconds instead of the normal 2-3 seconds.
11.1.1 Initial Investigation with Overview Pane
Open Activity Monitor and examine the Overview pane:
- The % Processor Time graph shows 85-95% CPU usage, significantly higher than the normal 30-40% baseline.
- Waiting Tasks fluctuates between 10-20 tasks, versus a normal baseline of 0-3.
- Database I/O shows moderate activity around 50 MB/s.
- Batch Requests/sec is lower than expected at 100/sec, versus a typical 300-400/sec during business hours.
This pattern suggests CPU bottleneck with resource contention causing reduced throughput. The server is working hard but not processing many requests.
11.1.2 Identifying the Problematic Query
Expand the Recent Expensive Queries pane and sort by Executions/min:
- The top query shows 15,000 executions per minute.
- Right-click and select Edit Query Text to examine the query.
- The query is a simple SELECT statement retrieving a single user record:
SELECT * FROM Users WHERE UserId = @UserId. - This query should not execute 15,000 times per minute for normal application usage.
Right-click the query and select Show Execution Plan. The plan shows a table scan on the Users table with a warning about a missing index on the UserId column.
Filter the Processes pane by Application to show only the web application’s connections. Multiple sessions show this same query running repeatedly.
11.1.3 Resolution and Verification
The problem stems from two issues: excessive query executions and a missing index. Resolution steps:
- Create the missing index:
CREATE NONCLUSTERED INDEX IX_Users_UserId ON Users (UserId); - Contact the development team about the excessive executions. Investigation reveals an N+1 query problem in the application code where a loop retrieves user details for each item in a list.
- Modify the application to batch the user lookups into a single query using an IN clause or table-valued parameter.
- Verify the fix by monitoring Activity Monitor after deployment. CPU usage drops to 35-40%, executions per minute decrease to 200-300, and application response times return to normal.
11.2 Case Study: Resolving a Blocking Issue
Users report that the order entry system is periodically freezing for 30-60 seconds before resuming normal operation.
11.2.1 Detecting the Blocking Chain
Open Activity Monitor during one of these freeze events and expand the Processes pane:
- Sort by Session ID to see all sessions organized.
- Multiple sessions show values in the Blocked By column, all pointing to Session ID 73.
- Session 73 shows ‘1’ in the Head Blocker column, confirming it’s the root cause.
- The Wait Type for blocked sessions shows LCK_M_X, indicating they’re waiting for exclusive locks.
- The Wait Resource column reveals the blocking is on the Orders table.
11.2.2 Analyzing the Cause
Right-click Session 73 and select Details to view the command:
UPDATE Orders
SET Status = 'Processing',
    LastModified = GETDATE()
WHERE OrderId IN (SELECT OrderId FROM #TempOrders);
This update is part of a batch processing job that runs hourly. Checking the Login column confirms the session belongs to the batch processing service account.
The query is holding locks on the Orders table while processing thousands of orders. The Wait Time for blocked sessions increases steadily, confirming this long-running operation is the problem.
11.2.3 Implementing the Fix
Short-term resolution:
- Document Session 73’s details including the query text and duration.
- Allow the update to complete naturally since it’s legitimate batch processing.
- After completion, verify blocked sessions clear and normal operations resume.
Long-term solutions implemented:
- Reschedule the batch job to run during off-peak hours (2-4 AM instead of during business hours).
- Modify the batch processing to update orders in smaller batches of 100 records at a time, releasing locks between batches.
- Add an index on the OrderId column to speed up the update operation.
- Consider SNAPSHOT isolation for read operations to reduce blocking impact.
11.3 Case Study: Identifying Excessive Query Executions
Database monitoring shows CPU usage has gradually increased over the past month, but no obvious changes have occurred in application code.
11.3.1 Spotting Abnormal Execution Counts
Open Activity Monitor and examine the Recent Expensive Queries pane:
- Sort by Executions/min to see the most frequently executed queries.
- The top query shows 37,000 executions per minute—far higher than any other query.
- Right-click and select Edit Query Text.
- The query retrieves product category information:
SELECT CategoryId, CategoryName FROM ProductCategories WHERE CategoryId = @CategoryId; - This simple query should be fast and cacheable, yet it’s executing tens of thousands of times per minute.
11.3.2 Tracing to Application Code
In the Processes pane, find sessions executing this query:
- Note the Application column shows “ProductCatalogService”.
- Right-click one of these sessions and select Trace Process in SQL Server Profiler.
- SQL Profiler reveals the query executes repeatedly in rapid succession with different CategoryId values.
- Contact the development team managing ProductCatalogService for code review.
Code review reveals the problem: a recent change retrieves product listings with categories. For each product in the result set (often 1,000+ products), the code makes a separate database call to fetch category information—a classic N+1 query problem.
11.3.3 Optimizing the Application
Implement a proper fix:
- Modify the application query to use a JOIN retrieving products and their categories in a single database call:
SELECT p.ProductId, p.ProductName, c.CategoryId, c.CategoryName FROM Products p INNER JOIN ProductCategories c ON p.CategoryId = c.CategoryId WHERE p.Active = 1; - Deploy the updated code and monitor Activity Monitor.
- Verify the fix: Executions per minute for the category query drop from 37,000 to under 100, and overall CPU usage decreases by 40%.
- Document the lesson learned and share with the development team to prevent similar issues in future code changes.
12. Detect Potential Database Corruption
While Activity Monitor is not designed specifically to detect database corruption, certain patterns in its display may suggest underlying corruption issues that warrant further investigation.
12.1 Symptoms of Potential Database Corruption
If database corruption exists and is being accessed, you might occasionally see:
1. In the Processes Pane:
- Sessions stuck in SUSPENDED state with unusual wait types
- Processes showing error states
- Queries failing repeatedly
2. In the Resource Waits Pane:
- Unusual I/O-related wait types that could indicate disk problems (though this more likely indicates hardware issues rather than logical corruption)
3. In Recent Expensive Queries:
- Queries with abnormally high physical reads if they’re repeatedly trying to read corrupted pages
12.2 Further Check with DBCC CHECKDB
When Activity Monitor displays symptoms that suggest potential corruption, you should immediately run DBCC CHECKDB to verify database integrity. This command scans all database pages, validates checksums, and checks for logical consistency errors.
To learn more about how to use DBCC CHECKDB to check and fix database corruptions, see our comprehensive DBCC CHECKDB guide.
12.3 Repair with Professional Tools
If DBCC CHECKDB confirms database corruption, you have several options for repair:
- The preferred approach is restoring from a known good backup. See our comprehensive guide on how to back up and restore SQL Server databases.
- For minor corruption, DBCC CHECKDB with REPAIR_REBUILD may resolve issues.
- For critical databases without recent backups, professional SQL recovery software and services can often recover data that built-in repair options cannot.
13. Conclusion
SQL Server Activity Monitor stands as an invaluable tool for database administrators, providing immediate insights into server performance and helping diagnose issues quickly and effectively.
13.1 Summary of Key Points
Throughout this guide, we’ve explored how Activity Monitor helps you understand and troubleshoot SQL Server performance:
- Activity Monitor provides real-time visibility into processes, waits, queries, and I/O through an organized, graphical interface.
- The five panes—Overview, Processes, Resource Waits, Data File I/O, and Recent Expensive Queries—each offer unique perspectives on server activity.
- Common troubleshooting scenarios like excessive query executions, blocking chains, and high CPU usage become manageable with systematic Activity Monitor investigation.
- While powerful, Activity Monitor has limitations including lack of historical data, wait type grouping, and monitoring overhead that affect its applicability.
- Supplementing Activity Monitor with DMV queries, sp_WhoIsActive, Extended Events, and potentially third-party tools creates a comprehensive monitoring strategy.
- Following best practices for refresh intervals, closing Activity Monitor when not in use, and combining multiple panes for correlation maximizes its value while minimizing impact.
13.2 Activity Monitor as Part of Your Toolkit
Activity Monitor should serve as your first response tool for performance investigations, not your only tool. Its strength lies in providing immediate visibility during active troubleshooting, helping you quickly determine whether the database is the bottleneck and identify which specific aspects need deeper investigation.
Think of Activity Monitor as analogous to a dashboard in your car—it tells you immediately if something is wrong and helps you identify the general area of concern. Just as your car’s dashboard doesn’t tell you exactly why the check engine light illuminated, Activity Monitor points you toward problems without always revealing their complete root cause. That deeper analysis requires additional tools and expertise.
Integrate Activity Monitor into a broader toolkit that includes execution plan analysis, wait statistics tracking, historical monitoring solutions, and performance best practices. Use it in conjunction with proper indexing strategies, query optimization techniques, and capacity planning.
13.3 Continuing Your Learning Journey
Mastering Activity Monitor is just one step in becoming an effective database administrator. Continue building your skills by:
- Learning to interpret execution plans and identify inefficient operations
- Understanding SQL Server wait statistics and their implications
- Studying index design and optimization techniques
- Exploring SQL Server’s architecture and how it processes queries
- Practicing systematic troubleshooting methodologies
- Building experience with Extended Events for detailed tracing
- Understanding transaction isolation levels and their performance impact
Each performance investigation with Activity Monitor teaches you something new about how SQL Server works and how applications interact with databases. Document your findings, share knowledge with colleagues, and build a library of solutions for common problems.
13.4 Additional Resources
Expand your knowledge with these valuable resources:
- Open Activity Monitor in SQL Server Management Studio (SSMS)
 : Official SQL Server documentation on how to open Activity Monitor in SQL Server Management Studio (SSMS).
 - Activity Monitor : Official SQL Server document on how to use Activity Monitor.
14. Frequently Asked Questions (FAQ)
Q: What is SQL Server Activity Monitor?
A: SQL Server Activity Monitor is a built-in tool within SQL Server Management Studio that displays real-time information about processes running on a SQL Server instance and their impact on server resources. It provides a graphical dashboard with five panes showing different aspects of server activity including processor usage, waiting tasks, I/O rates, active sessions, and expensive queries.
Q: How do I open Activity Monitor in SSMS?
A: You can open Activity Monitor using four methods: (1) Click the Activity Monitor icon in the SSMS toolbar, (2) Right-click your SQL Server instance name in Object Explorer and select Activity Monitor, (3) Press Ctrl + Alt + A, or (4) Configure SSMS to launch it automatically via Tools -> Options -> Environment -> Startup.
Q: What permissions do I need to use Activity Monitor?
A: You need the VIEW SERVER STATE permission to see most Activity Monitor information. For the Data File I/O pane, you also need either CREATE DATABASE, ALTER ANY DATABASE, or VIEW ANY DEFINITION permissions. Without these permissions, Activity Monitor may open but display blank panes.
Q: Why is my Activity Monitor paused or not working?
A: Activity Monitor typically pauses due to permission issues, outdated SSMS versions, or disabled remote connections. To resolve: (1) Update to the latest SSMS version, (2) Verify you have VIEW SERVER STATE permission, (3) Check that remote connections are enabled on the SQL Server instance, (4) Restart SSMS, and (5) Try connecting with Windows authentication instead of SQL authentication if applicable.
Q: What’s the difference between Activity Monitor and sp_WhoIsActive?
A: Activity Monitor is a graphical tool built into SSMS providing organized panes for different monitoring aspects. sp_WhoIsActive is a free community-created stored procedure that returns detailed session information in a single result set with more specific wait types, blocking details, and customization options than Activity Monitor. Activity Monitor is better for visual exploration, while sp_WhoIsActive excels at scripted monitoring and provides more detailed information.
Q: Does Activity Monitor impact server performance?
A: Yes, Activity Monitor has measurable overhead because it queries system DMVs at each refresh interval. The impact increases with lower refresh rates—Microsoft warns that intervals below 10 seconds can affect server performance. Always close Activity Monitor when not actively using it, and consider 30-60 second refresh intervals on production servers under heavy load.
Q: Can I get Activity Monitor data using T-SQL?
A: Yes, Activity Monitor queries system dynamic management views like sys.dm_exec_requests, sys.dm_exec_sessions, sys.dm_os_wait_stats, and sys.dm_exec_query_stats. You can query these DMVs directly using T-SQL to retrieve equivalent information programmatically, enabling custom monitoring scripts and automated data collection.
Q: What is the default refresh interval?
A: The default refresh interval is 10 seconds. You can change this by right-clicking anywhere in the Overview pane, selecting Refresh Interval, and choosing from predefined options: 1 second, 5 seconds, 10 seconds, 30 seconds, 1 minute, or 1 hour. Lower intervals provide more real-time views but increase monitoring overhead.
Q: How can I automatically open Activity Monitor on SSMS startup?
A: Configure automatic launching through SSMS options: Navigate to Tools -> Options -> Environment -> Startup, then select Open Object Explorer and Activity Monitor from the At startup dropdown. Activity Monitor will automatically open each time you connect to a server in SSMS.
Q: What are the limitations of Activity Monitor?
A: Key limitations include: (1) No historical data storage or trending capabilities, (2) Wait types are grouped into categories rather than shown specifically, (3) Some wait types like CXPACKET may not appear, (4) Point-in-time snapshots may miss transient issues, (5) Monitoring overhead can impact busy servers, (6) No alerting mechanism for proactive monitoring, and (7) Cannot aggregate data across multiple SQL Server instances. For these needs, supplement Activity Monitor with Extended Events, data collection sets, or third-party monitoring tools.
About the Author
Yuan Sheng is a senior database administrator (DBA) with over 10 years of experience in SQL Server environments and enterprise database management. He has successfully resolved hundreds of database recovery scenarios across financial services, healthcare, and manufacturing organizations.
Yuan specializes in SQL Server database recovery, high availability solutions, and performance optimization. His extensive hands-on experience includes managing multi-terabyte databases, implementing Always On Availability Groups, and developing automated backup and recovery strategies for mission-critical business systems.
Through his technical expertise and practical approach, Yuan focuses on creating comprehensive guides that help database administrators and IT professionals solve complex SQL Server challenges efficiently. He stays current with the latest SQL Server releases and Microsoft’s evolving database technologies, regularly testing recovery scenarios to ensure his recommendations reflect real-world best practices.
Have questions about SQL Server recovery or need additional database troubleshooting guidance? Yuan welcomes feedback and suggestions for improving these technical resources.